
MATLAB R2023a更新了哪些好玩的东西?
R2023a来啦!!废话不多说看看新版本有啥有趣的玩意和好玩的特性叭!!把绘图放最前面叭,有图的内容看的人多。
1 区域填充
可以使用xregion及yregion进行区域填充啦!!
x = -10:0.25:10;
y = x.^2;
plot(x,y)
xregion(-5,5)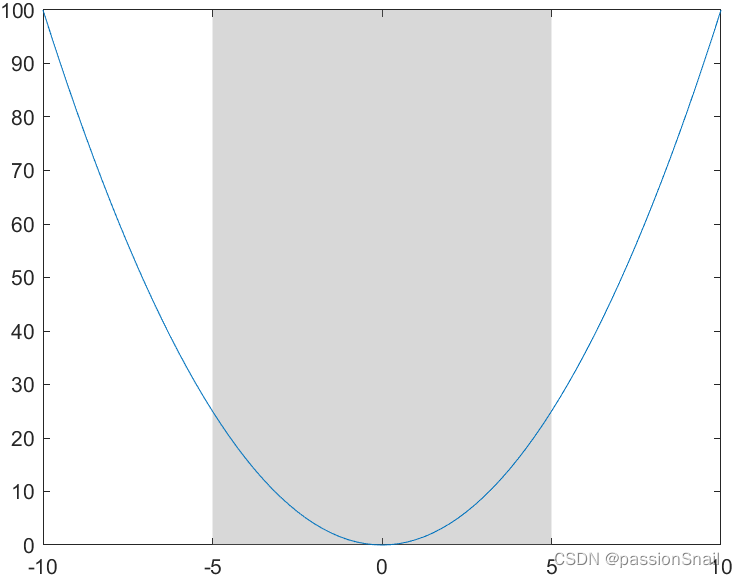
Count = randn(1,1000);
histogram(Count)
xr = xregion([-2 1],[-1 2]);
Count = randn(1,1000);
histogram(Count)
xr = xregion([-2 1],[-1 2]); xr(1).FaceColor = "r";
xr(1).DisplayName = "Low";
xr(2).FaceColor = "#0073FD";
xr(2).DisplayName = "High";
legend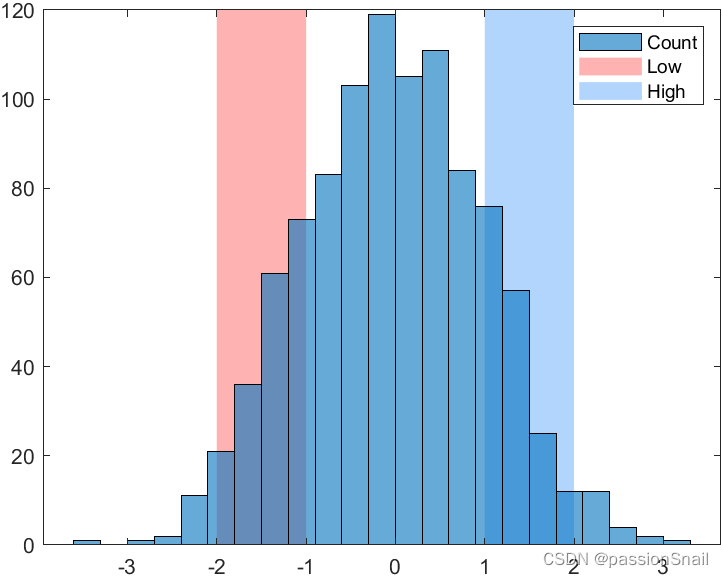
x = 0:0.1:50;
y = 2*x .* (sin(x) + cos(2*x));
plot(x,y)
yregion(0,106)
2 新配色sky
这么多年了终于出了个新配色,这个就是heatmap函数使用的默认配色:
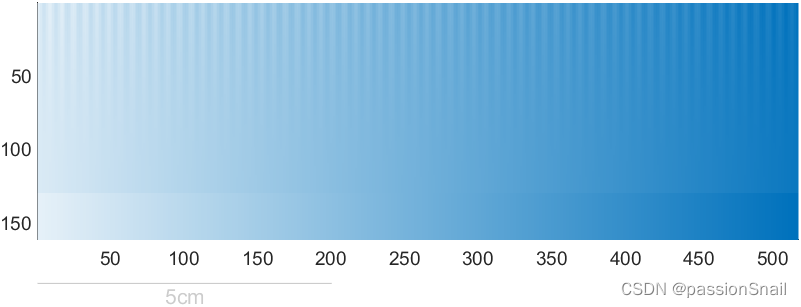
展示一下叭:
X=rand(10);
CF=contourf(X);
colormap(sky)
colorbar 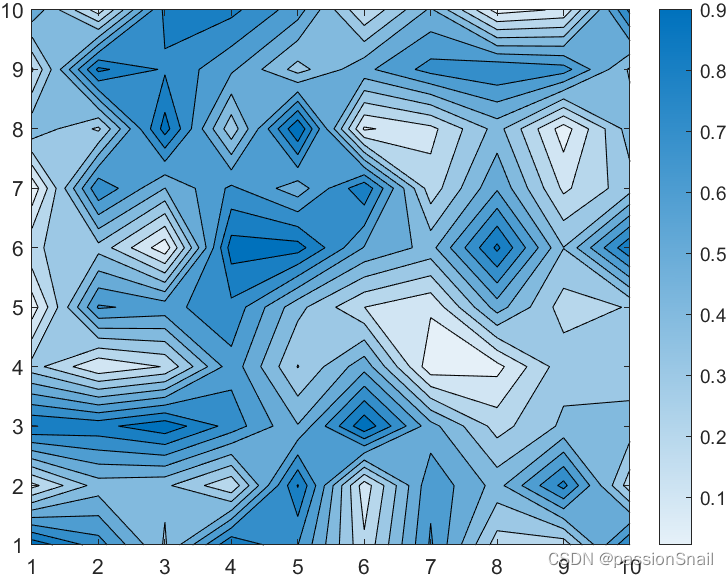
X=linspace(0,1,200)';
CL=(-cos(X*2*pi)+1).^.2;
r=(X-.5)'.^2+(X-.5).^2;
surf(X,X',abs(ifftn(exp(7i*rand(200))./r.^.9)).*(CL*CL')*30,'EdgeColor','none')colormap(sky)
light
material dull
view(59.1823,56.1559)
colorbar% 修饰一下
ax=gca;
ax.Projection='perspective';
ax.LineWidth=.8;
ax.XMinorTick='on';
ax.YMinorTick='on';
ax.ZMinorTick='on';
ax.GridLineStyle=':';
ax.FontName='Cambria';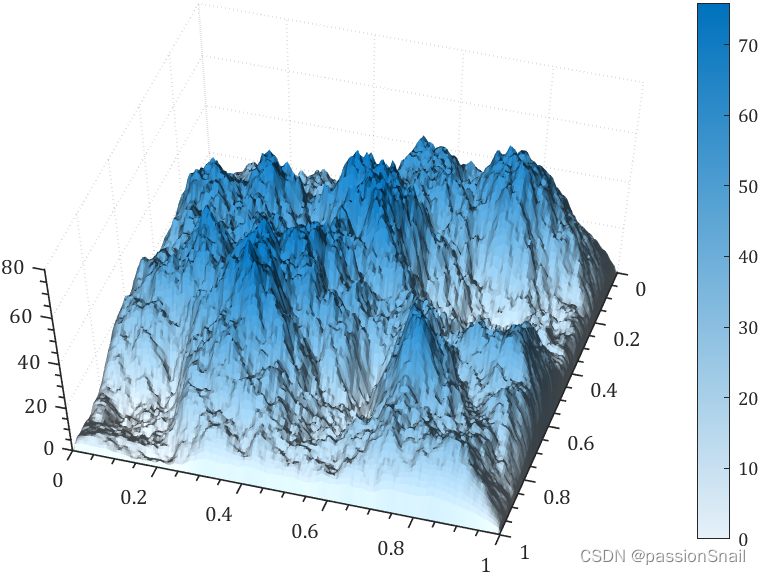
t=linspace(0,5*pi,200);
C=sky(70);
ax=gca;hold on
for i=1:70plot(t,sin(t+i.^2./700)./(10+i).*20+i.*.1,'Color',C(i,:),'LineWidth',2);
end% 坐标区域修饰
ax.YLim=[0,7];
ax.XLim=[0,5*pi];
ax.YTick=0:.5:5;
ax.XTick=0:1:15;
% ax.XGrid='on';
ax.YGrid='on';
ax.GridLineStyle='-.';
ax.LineWidth=1.2;
ax.XMinorTick='on';
ax.YMinorTick='on';
ax.Box='on';
ax.FontName='Cambria';
ax.FontWeight='bold';
ax.FontSize=12;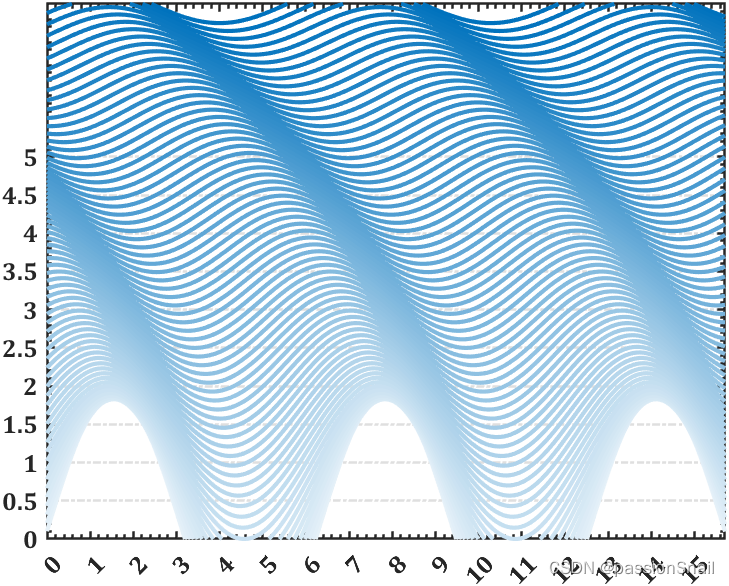
3 tiledlayout水平或竖直布局
不需要预定义几行几列,设置为horizontal或vertical之后,就一直往上加就完事:
tiledlayout("horizontal")
x = 1:5;
nexttile
plot(x)
nexttile
bar(x);
nexttile
contourf(peaks)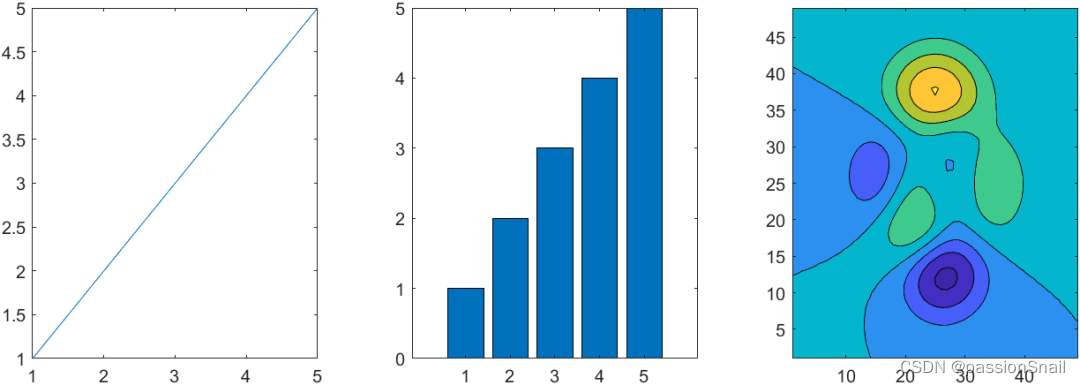
4 网格粗细
网格粗细可以不和坐标轴粗细相同啦,通过设置GridLineWidth属性设置网格粗细:
t=linspace(0,4*pi,300);
ax1=axes(gcf,'Position',[0+.05,.05,1/2-.05,.95]);
grid on;hold on;box on;axis tight
ax1.LineWidth=4;
plot(t,sin(t),'LineWidth',2)ax2=axes(gcf,'Position',[1/2+.05,.05,1/2-.05,.95]);
grid on;hold on;box on;axis tight
ax2.LineWidth=4;
ax2.GridLineWidth=1;
plot(t,sin(t),'LineWidth',2)
5 轴标签旋转
轴标签可以旋转了,比如编写了如下代码:
plot([0 3 1 6 4 10],'LineWidth',2)
ylab = ylabel("Y Data");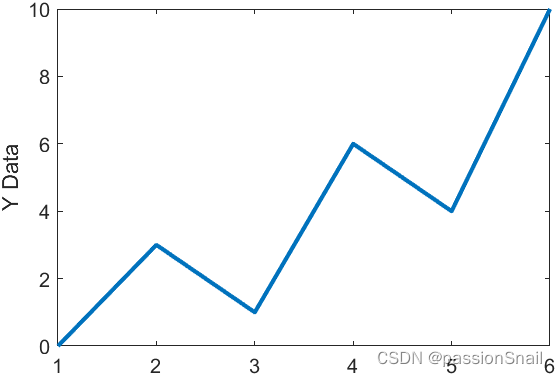
ylab.Rotation = 0;
6 颜色与线形
可以同时变,可以线条先变可以颜色先变,通过设置LineStyleCyclingMethod 属性来控制:
"withcolor"— 同时进行
"beforecolor"— 先线条循环
"aftercolor"— 先颜色循环
t=linspace(0,2.5*pi,200)+1*pi;tiledlayout("horizontal",'TileSpacing','tight','Padding','tight')
ax1=nexttile();hold on;axis tight;box on
ax1.Title.String='withcolor';
ax1.Title.FontWeight='bold';
ax1.Title.FontSize=25;
ax1.LineWidth=1;
ax1.LineStyleOrder={'-','--',':'};
ax1.LineStyleCyclingMethod='withcolor';
for i=1:4plot(t,sin(t-pi/3*(i-1)),'LineWidth',2)
endax2=nexttile();hold on;axis tight;box on
ax2.Title.String='beforecolor';
ax2.Title.FontWeight='bold';
ax2.Title.FontSize=25;
ax2.LineWidth=1;
ax2.LineStyleOrder={'-','--',':'};
ax2.LineStyleCyclingMethod='beforecolor';
for i=1:4plot(t,sin(t-pi/3*(i-1)),'LineWidth',2)
endax3=nexttile();hold on;axis tight;box on
ax3.Title.String='aftercolor';
ax3.Title.FontWeight='bold';
ax3.Title.FontSize=25;
ax3.LineWidth=1;
ax3.LineStyleOrder={'-','--',':'};
ax3.LineStyleCyclingMethod='aftercolor';
for i=1:4plot(t,sin(t-pi/3*(i-1)),'LineWidth',2)
end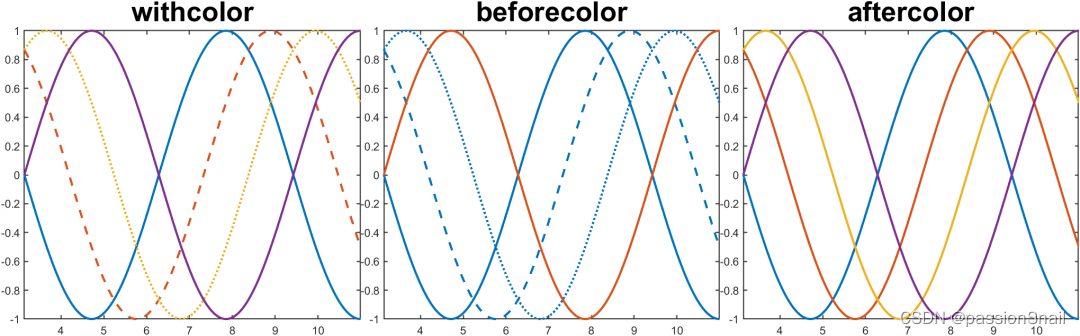
7 通过addStyle往app列表框增添图标
fig = uifigure('Position',[200,200,200,200]);
lb = uilistbox(fig,"Items",["Peppers","Nebula","Street"],'Position',[0,0,200,200]);s1 = uistyle("Icon","peppers.png");
s2 = uistyle("Icon","ngc6543a.jpg");
s3 = uistyle("Icon","street1.jpg");addStyle(lb,s1,"item",1);
addStyle(lb,s2,"item",2);
addStyle(lb,s3,"item",3);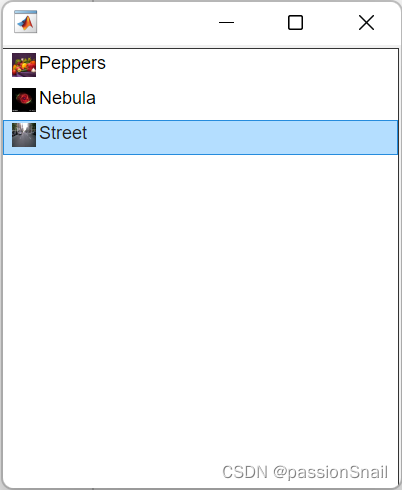
8 app uistack排序
创建五个具有不同标题和背景颜色的重叠面板。
f = figure;a = uipanel(f,'Title','A','BackgroundColor','white');
b = uipanel(f,'Title','B','BackgroundColor','cyan');
c = uipanel(f,'Title','C','BackgroundColor','green');
d = uipanel(f,'Title','D','BackgroundColor','yellow');
e = uipanel(f,'Title','E','BackgroundColor','magenta');a.Position = [0.35 0.50 0.30 0.35];
b.Position = [0.18 0.40 0.30 0.35];
c.Position = [0.08 0.21 0.30 0.35];
d.Position = [0.25 0.33 0.32 0.35];
e.Position = [0.30 0.27 0.30 0.35];
figChildren = f.Children
% figChildren =
%
%   5×1 Panel array:
%
%   Panel    (E)
%   Panel    (D)
%   Panel    (C)
%   Panel    (B)
%   Panel    (A)
将c d上移
comp = [c d];
uistack(comp,'up');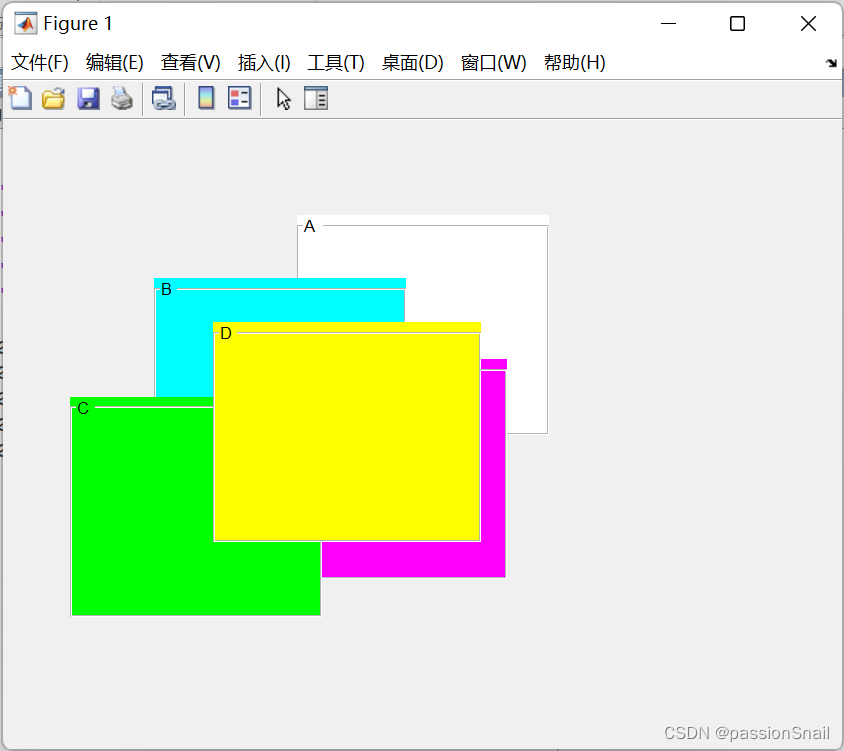
figChildren = f.Children
% figChildren =
%
%   5×1 Panel 数组:
%
%   Panel    (D)
%   Panel    (C)
%   Panel    (E)
%   Panel    (B)
%   Panel    (A)
当然uistack可以设置参数为up,down,top,bottom。
9 uipanel border
通过BorderColor,BorderWidth可设置uibuttongroup及uipanel边框颜色和粗细:
f = figure();a=uipanel(f,'Title','A','BorderColor',[.8,0,0],'BorderWidth',8);
b=uipanel(f,'Title','B','BorderColor',[0,0,.8],'BorderWidth',8);a.Position = [0.2 0.4 0.7 0.4];
b.Position = [0.1 0.2 0.5 0.4];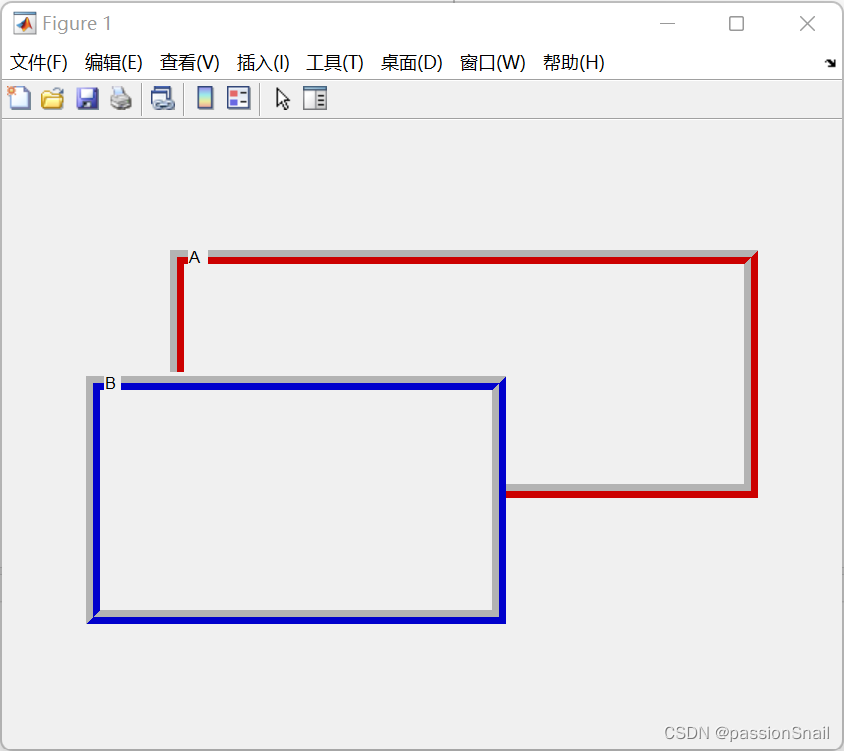
10 uiimage 动图及链接
fig = uifigure('Position',[100,100,300,300]);
im = uiimage(fig,'ImageSource','test.gif','Position',[0,0,200,200]);
im.ScaleMethod = 'scaledown';
将图像配置为点击时打开链接:
fig = uifigure;
im = uiimage(fig);
im.ImageSource = "membrane.png";
im.URL = "https://www.mathworks.com/";
im.Tooltip = "Go to www.mathworks.com";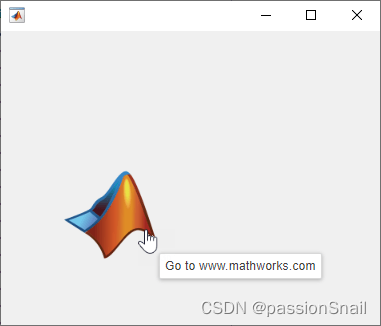
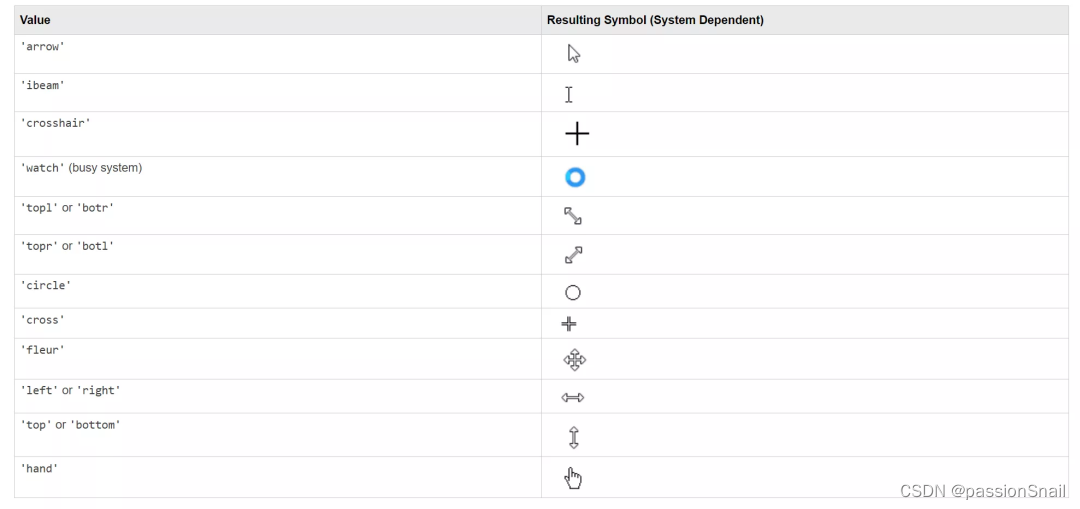
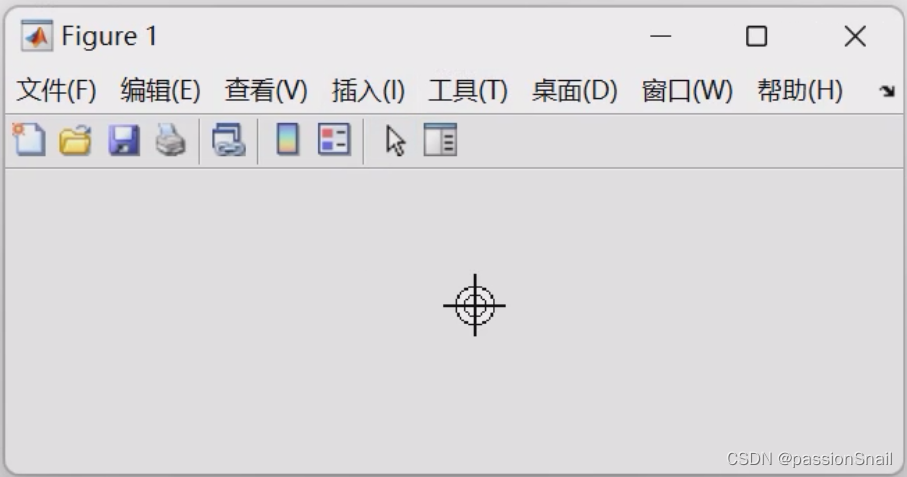
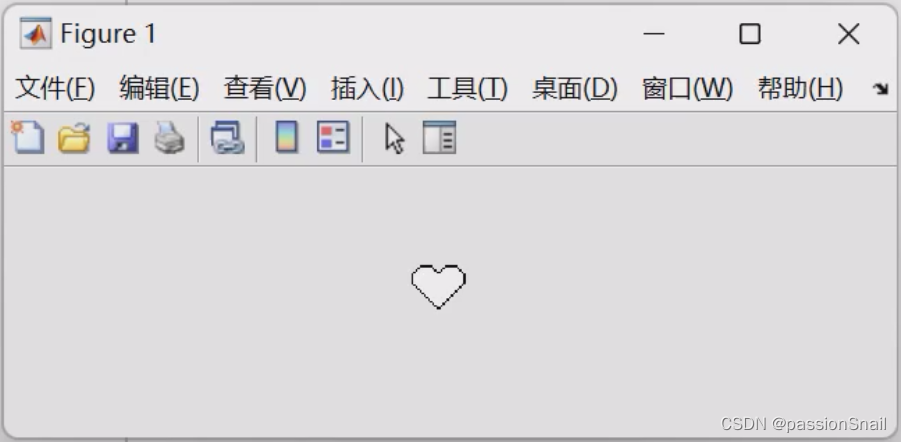
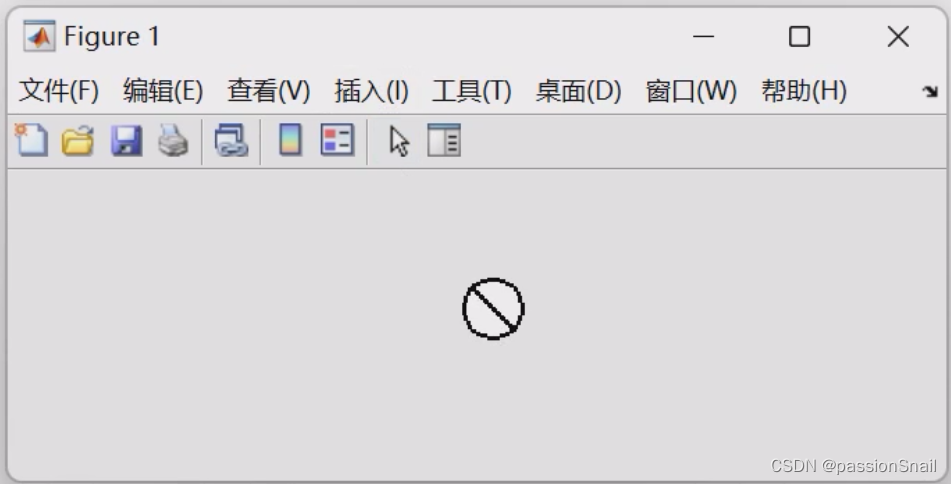
11 app uifigure 鼠标指针
uifigure 鼠标指针的鼠标指针可以自定义啦。
fig = uifigure;
fig.Pointer='watch';
光标能设置的类型不多:
12 默认不再安装本地文档
就是说本地默认不会再存储函数的介绍文档了,一些函数介绍需要联网才能看,以下在断网的时候分别在R2022b及R2023a命令行窗口运行:
doc plot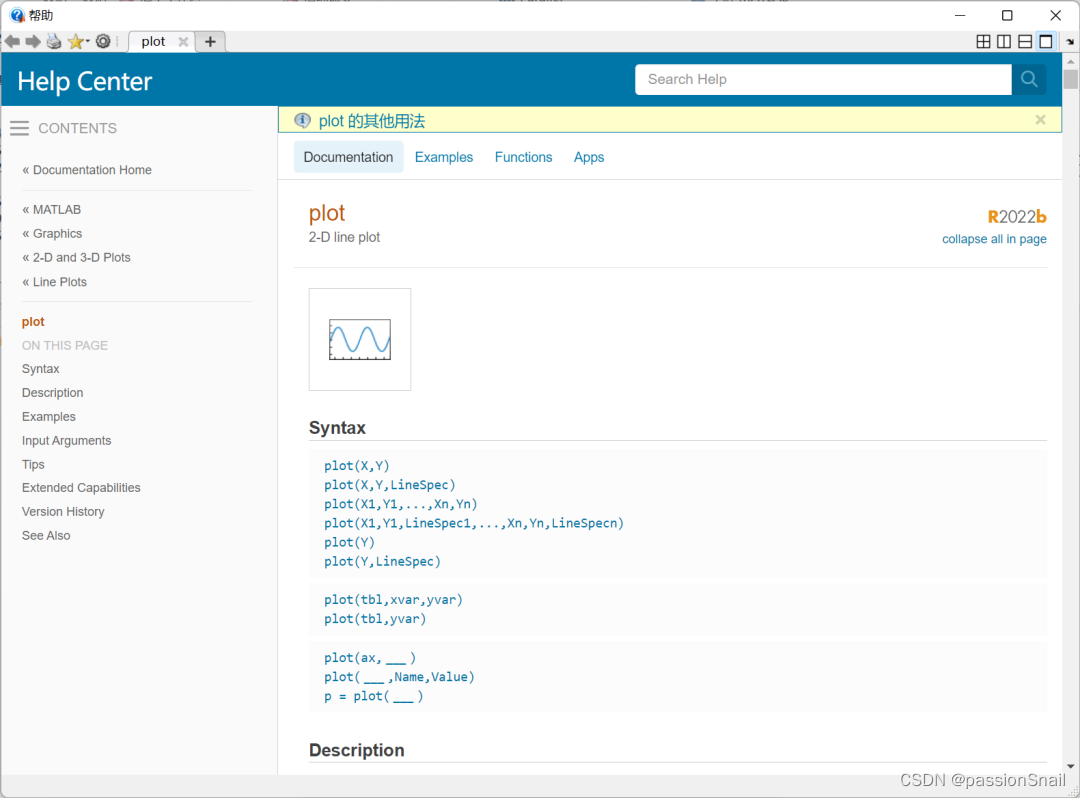
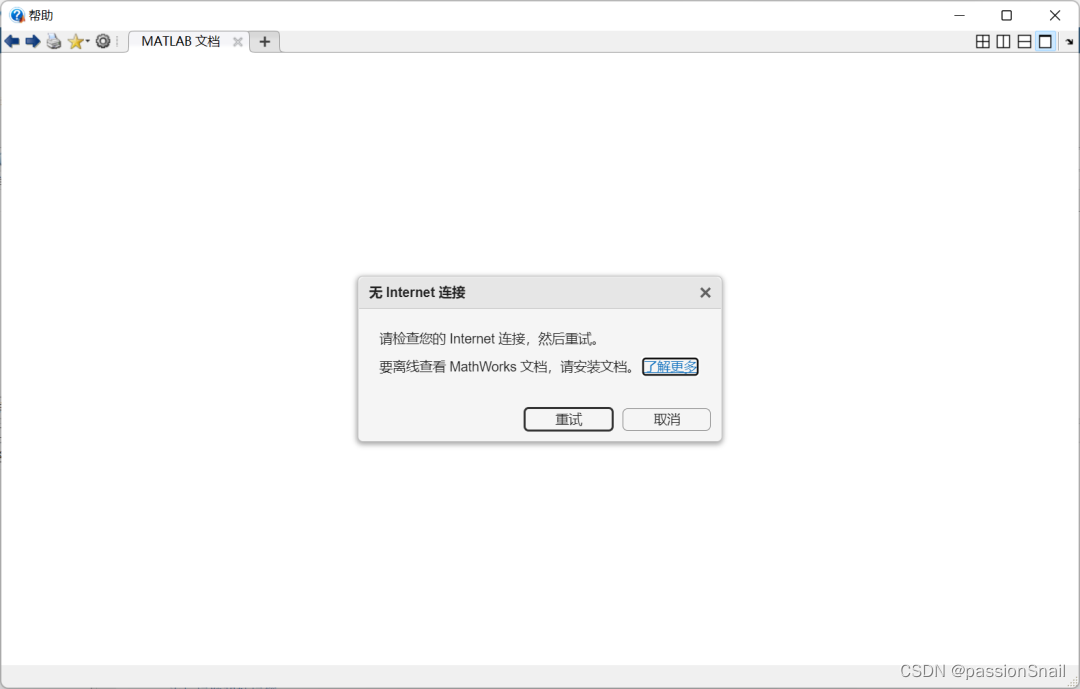
可以看到R2022b能够调出本地文档,R2023a只会提醒你没联网,有好有坏吧,好处是能减小MATLAB的安装大小,统计了一些常用的包都不安装文档可以节省10G左右空间,我装R2023a总体积15G左右。
当然如果经常在没网的地方默默敲代码,还是可以手动装文档的:https://ww2.mathworks.cn/help/install/ug/install-documentation.html
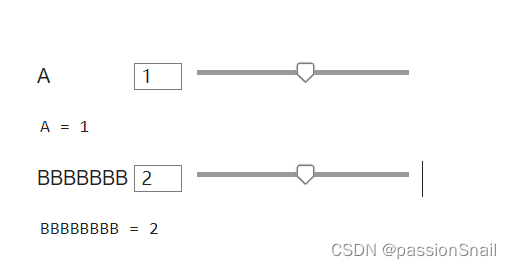
13 实时编辑器更新
实时编辑器增添了文件选择控件:

隐藏代码时对齐部分控件,这确实是没啥用的小更新,比如我控件名字BBBBBBB比A长很多也会自动对齐:
14 代码自动修复
逻辑复杂的代码就别想了,官方给的简单例子:假设编写了名为exampleScript.m的m文件,其中内容为:
x = [1 2 3]
for n = 1:3y(n) = x
end
命令行窗口运行如下代码就能获得问题列表:
issues=codeIssues("exampleScript")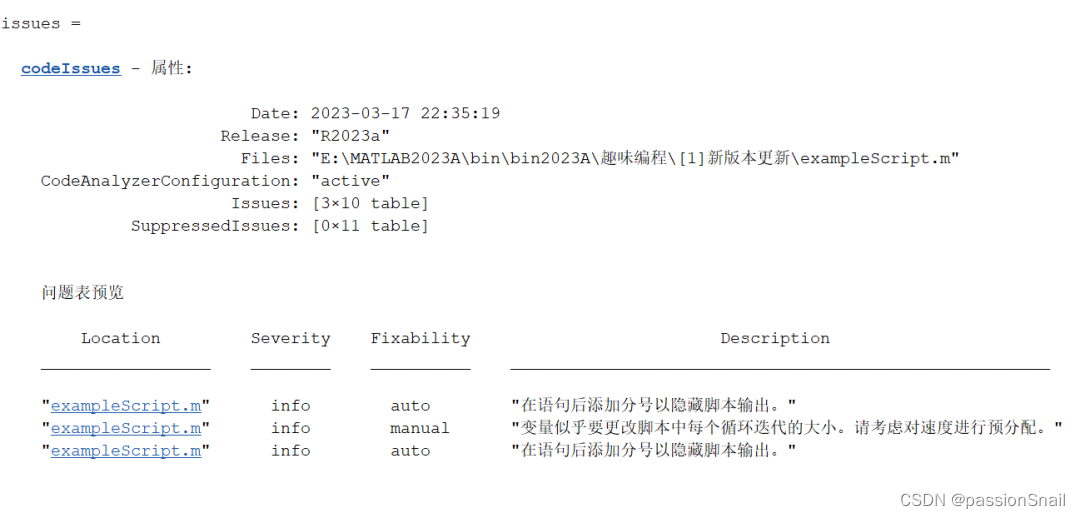
"exampleScript.m" info auto "在语句后添加分号以隐藏脚本输出。"
"exampleScript.m" info manual "变量似乎要更改脚本中每个循环迭代的大小。请考虑对速度进行预分配。"
"exampleScript.m" info auto "在语句后添加分号以隐藏脚本输出。"
只有标注auto的才能自动修复: 再在命令行窗口运行如下代码:
fix(issues,"NOPTS")emmmmmmmmm发现MATLAB自动帮你加了俩分号哈哈哈哈哈哈,关于没预定义y管都没管。。。。。目前来看估计得等好几代后才会有真正有用的自动代码修复。。。
15 获取所有元素的组合
一个非常有用的函数combinations!
ID = ["A" "B" "C"];
color = ["red" "blue" "green"];
sz = ["small" "large"];T = combinations(ID,color,sz)
运行结果:
T = 18×3 tableID color sz ___ _______ _______"A" "red" "small""A" "red" "large""A" "blue" "small""A" "blue" "large""A" "green" "small""A" "green" "large""B" "red" "small""B" "red" "large""B" "blue" "small""B" "blue" "large""B" "green" "small""B" "green" "large""C" "red" "small""C" "red" "large""C" "blue" "small""C" "blue" "large""C" "green" "small""C" "green" "large"16 数据去除NaN
一个很有用的函数fillmissing2,可以将二维数据中NaN部分数值用周围数的插值替代:
A = magic(5);
A(1,2) = NaN;
A(3:4,3:4) = NaN
构建的矩阵展示:
A = 5×517 NaN 1 8 1523 5 7 14 164 6 NaN NaN 2210 12 NaN NaN 311 18 25 2 9去除NaN值:
F = fillmissing2(A,"nearest")F = 5×517 1 1 8 1523 5 7 14 164 6 7 22 2210 12 25 3 311 18 25 2 9官方给了一个填充效果可视化的例子:
n = 51;
[x,y] = meshgrid(linspace(-2,2,n));
f = x.^2-y.^2;NaNPercent = 0.05;
randEntries = randperm(n^2,round(NaNPercent*n^2));
f(randEntries) = NaN;F = fillmissing2(f,"linear");
x = reshape(x,n^2,1);
y = reshape(y,n^2,1);
f = reshape(f,n^2,1);
F = reshape(F,n^2,1);filledData = scatter3(x,y,F,24,"red","filled",...MarkerEdgeColor="black");
hold on
originalData = scatter3(x,y,f,24,"green","filled",...MarkerEdgeColor="black");
legend([filledData,originalData],...{"Filled","Original"},Location="north")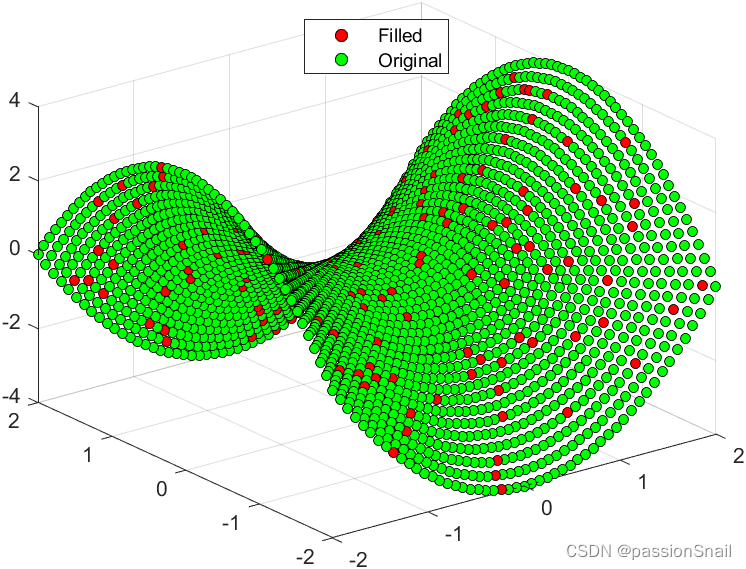
当然一维补全也有fillmissing函数:
x = [-4*pi:0.1:0, 0.1:0.2:4*pi];
A = sin(x);A(A < 0.75 & A > 0.5) = NaN;[F,TF] = fillmissing(A,'linear','SamplePoints',x);scatter(x,A,'filled')
hold on
scatter(x(TF),F(TF),'filled')
legend('Original Data','Filled Data')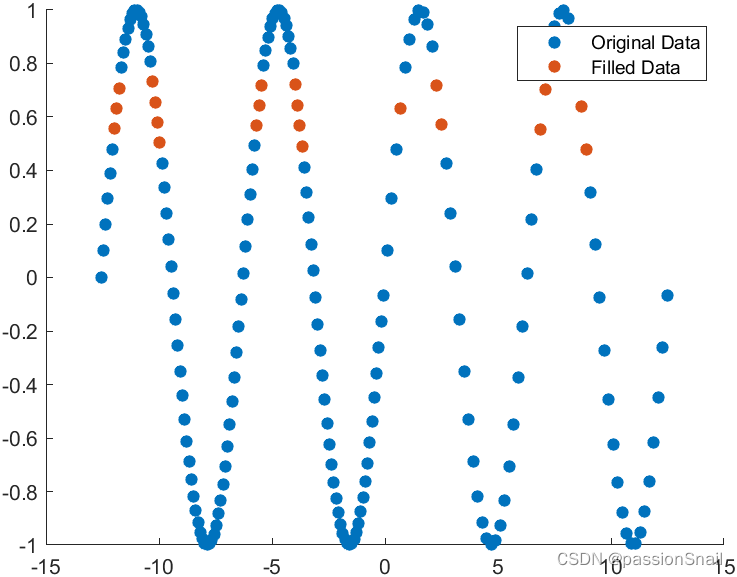
17 随机逻辑数组构建
目前来看还是比较鸡肋,以下两种写法说实话区别不大,可能也就速度略快:
tic
A1=randi([0 1],5)>0;
toctic
A2=randi([0 1],5,"logical");
toc
小数组时新写法创建速度是旧写法的两倍,但是对于比较大的数组来说,俩速度几乎完全一致。
完
以上是本次更新中比较有趣的内容,更的属实不少,反正才15G左右,这不赶快进行一波新版本的安装?