
【2023】Prometheus-先搭出来玩玩
创始人
2024-05-23 15:11:32
0次
找两台还没回收的服务器(虚拟机),使用centos7.*系统
一台作为监控端,一台作为被监控端。
目录
- 1.快速部署Prometheus服务
- 2.快速部署被监控端加入监控端
- 3.使用grafana作为UI展示
- 4.导入node_exporter模板监控node节点
1.快速部署Prometheus服务
- 下载二进制安装包(当然docker安装更快)
wget https://github.com/prometheus/prometheus/releases/download/v2.42.0/prometheus-2.42.0.linux-amd64.tar.gz
- 将压缩包解压到指定目录
[root@localhost ~]# mkdir /data
[root@localhost ~]# tar xf prometheus-2.42.0.linux-amd64.tar.gz -C /data/
[root@localhost ~]# cd /data/
[root@localhost data]# ls
prometheus-2.42.0.linux-amd64
[root@localhost data]# ln -s prometheus-2.42.0.linux-amd64/ prometheus
-
添加Prometheus为系统服务开机启动(注意user、group、IP用自己的)
vim /usr/lib/systemd/system/prometheus.service
[Unit]
Description=Prometheus server daemon
After=network.target[Service]
Type=simple
User=root
Group=root
ExecStart=/data/prometheus/prometheus \--config.file "/data/prometheus/prometheus.yml" \--storage.tsdb.path "/data/prometheus/data" \--storage.tsdb.retention=15d \--web.console.templates="/data/prometheus/consoles" \--web.console.libraries="/data/prometheus/console_libraries" \--web.max-connections=512 \--web.external-url "http://192.168.10.2:9090" \--web.listen-address "0.0.0.0:9090"
Restart=on-failure[Install]
WantedBy=multi-user.target
- 启动服务
[root@localhost prometheus]# systemctl daemon-reload
[root@localhost prometheus]# systemctl start prometheus.service
[root@localhost prometheus]# systemctl enable prometheus.service
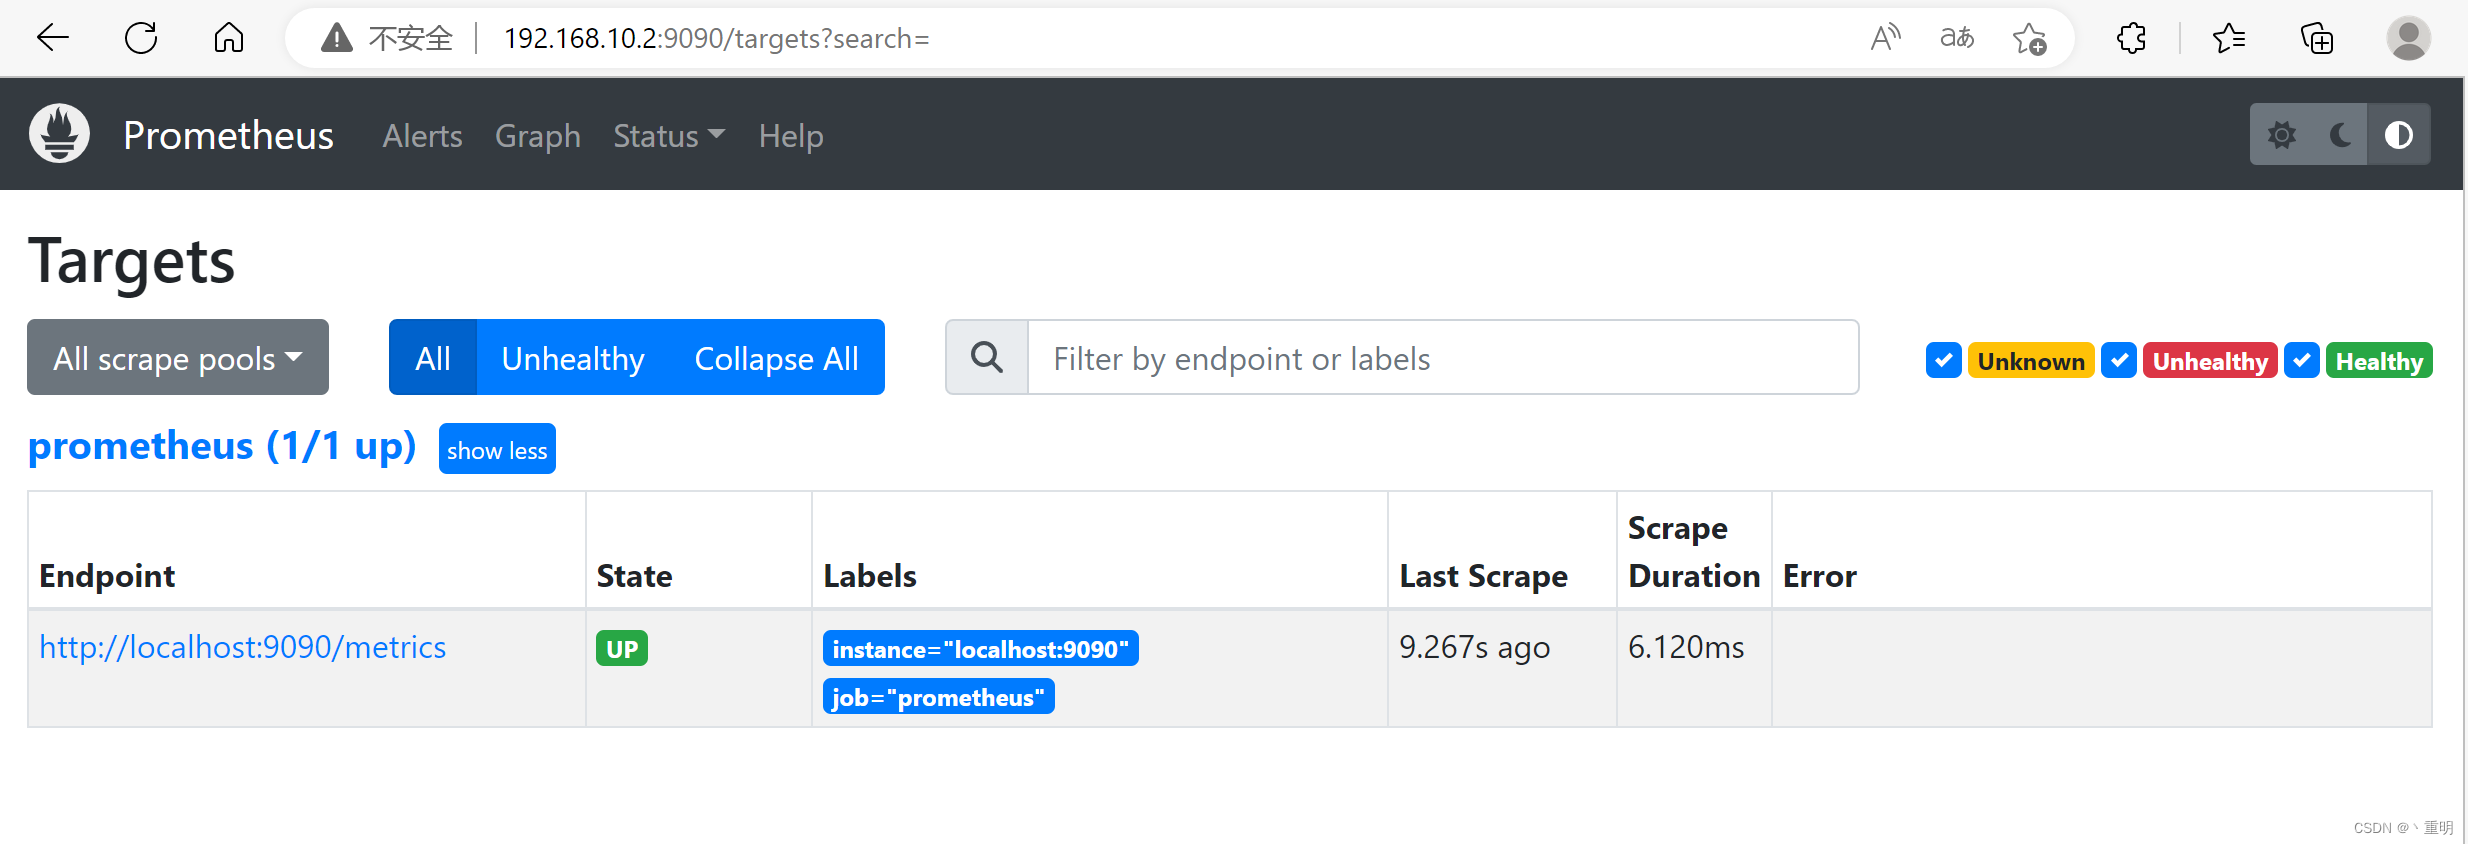
- 网页登录测试
2.快速部署被监控端加入监控端
- 依然先下载软件包
wget https://github.com/prometheus/node_exporter/releases/download/v1.5.0/node_exporter-1.5.0.linux-amd64.tar.gz
- 依然将软件包解压到/data目录
[root@node-centos ~]# mkdir /data
[root@node-centos ~]# tar xf node_exporter-1.5.0.linux-amd64.tar.gz -C /data/
[root@node-centos ~]# cd /data/
[root@node-centos data]# ls
node_exporter-1.5.0.linux-amd64
[root@node-centos data]# ln -s node_exporter-1.5.0.linux-amd64/ node_exporter
-
依然将服务加入到开机启动
vim /usr/lib/systemd/system/node_exporter.service
[Unit]
Description=node_exporter
Documentation=https:// prometheus.io/
After=network-online.target
[Service]
Type=simple
User=root
Group=root
ExecStart=/data/node_exporter/node_exporter
Restart=on-failure
[Install]
WantedBy=multi-user.target
- 启动服务(确认启动成功就可以接下来的步骤了)
[root@node-centos data]# systemctl daemon-reload
[root@node-centos data]# systemctl start node_exporter.service
[root@node-centos data]# systemctl enable node_exporter.service
[root@node-centos data]# systemctl status node_exporter.service
-
修改服务端配置文件,将被监控端加入服务端(在scrape_configs: 块下加入以下内容,注意ip是自己的
)vim /data/prometheus/prometheus.yml
- job_name: "node_exporter"static_configs:- targets: ["192.168.10.3:9100"
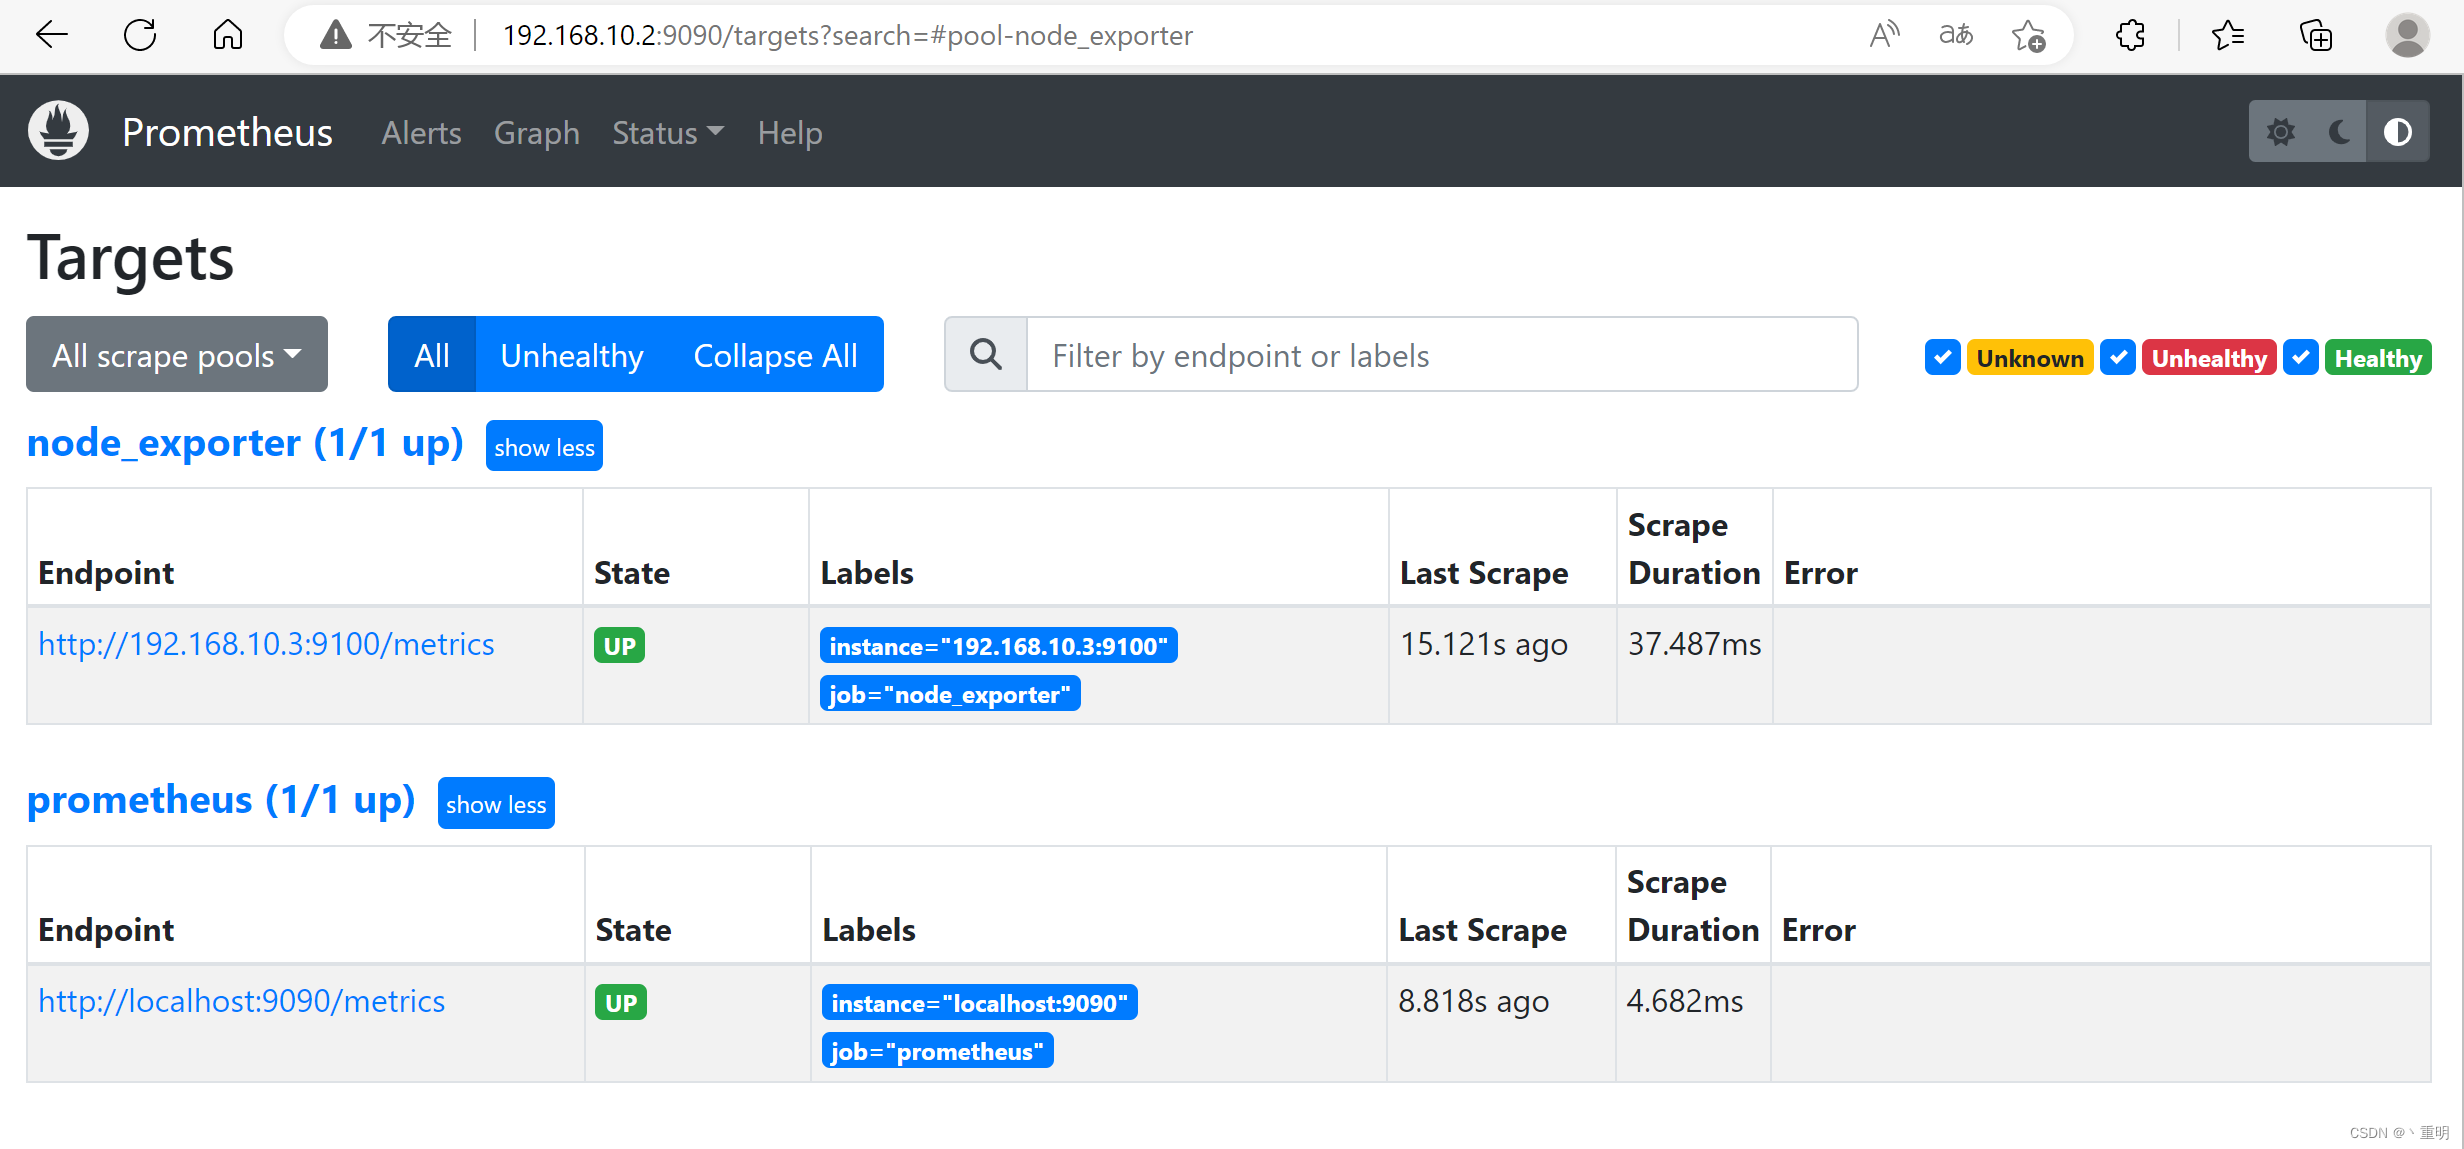
- 重启prometheus服务然后在网页查看是否监控到节点
[root@localhost ~]# systemctl restart prometheus.service
3.使用grafana作为UI展示
以下操作在服务端进行
- 安装grafana服务(官方命令直接复制,此版本为最新版)
wget https://dl.grafana.com/enterprise/release/grafana-enterprise-9.3.6-1.x86_64.rpm
sudo yum install grafana-enterprise-9.3.6-1.x86_64.rpm
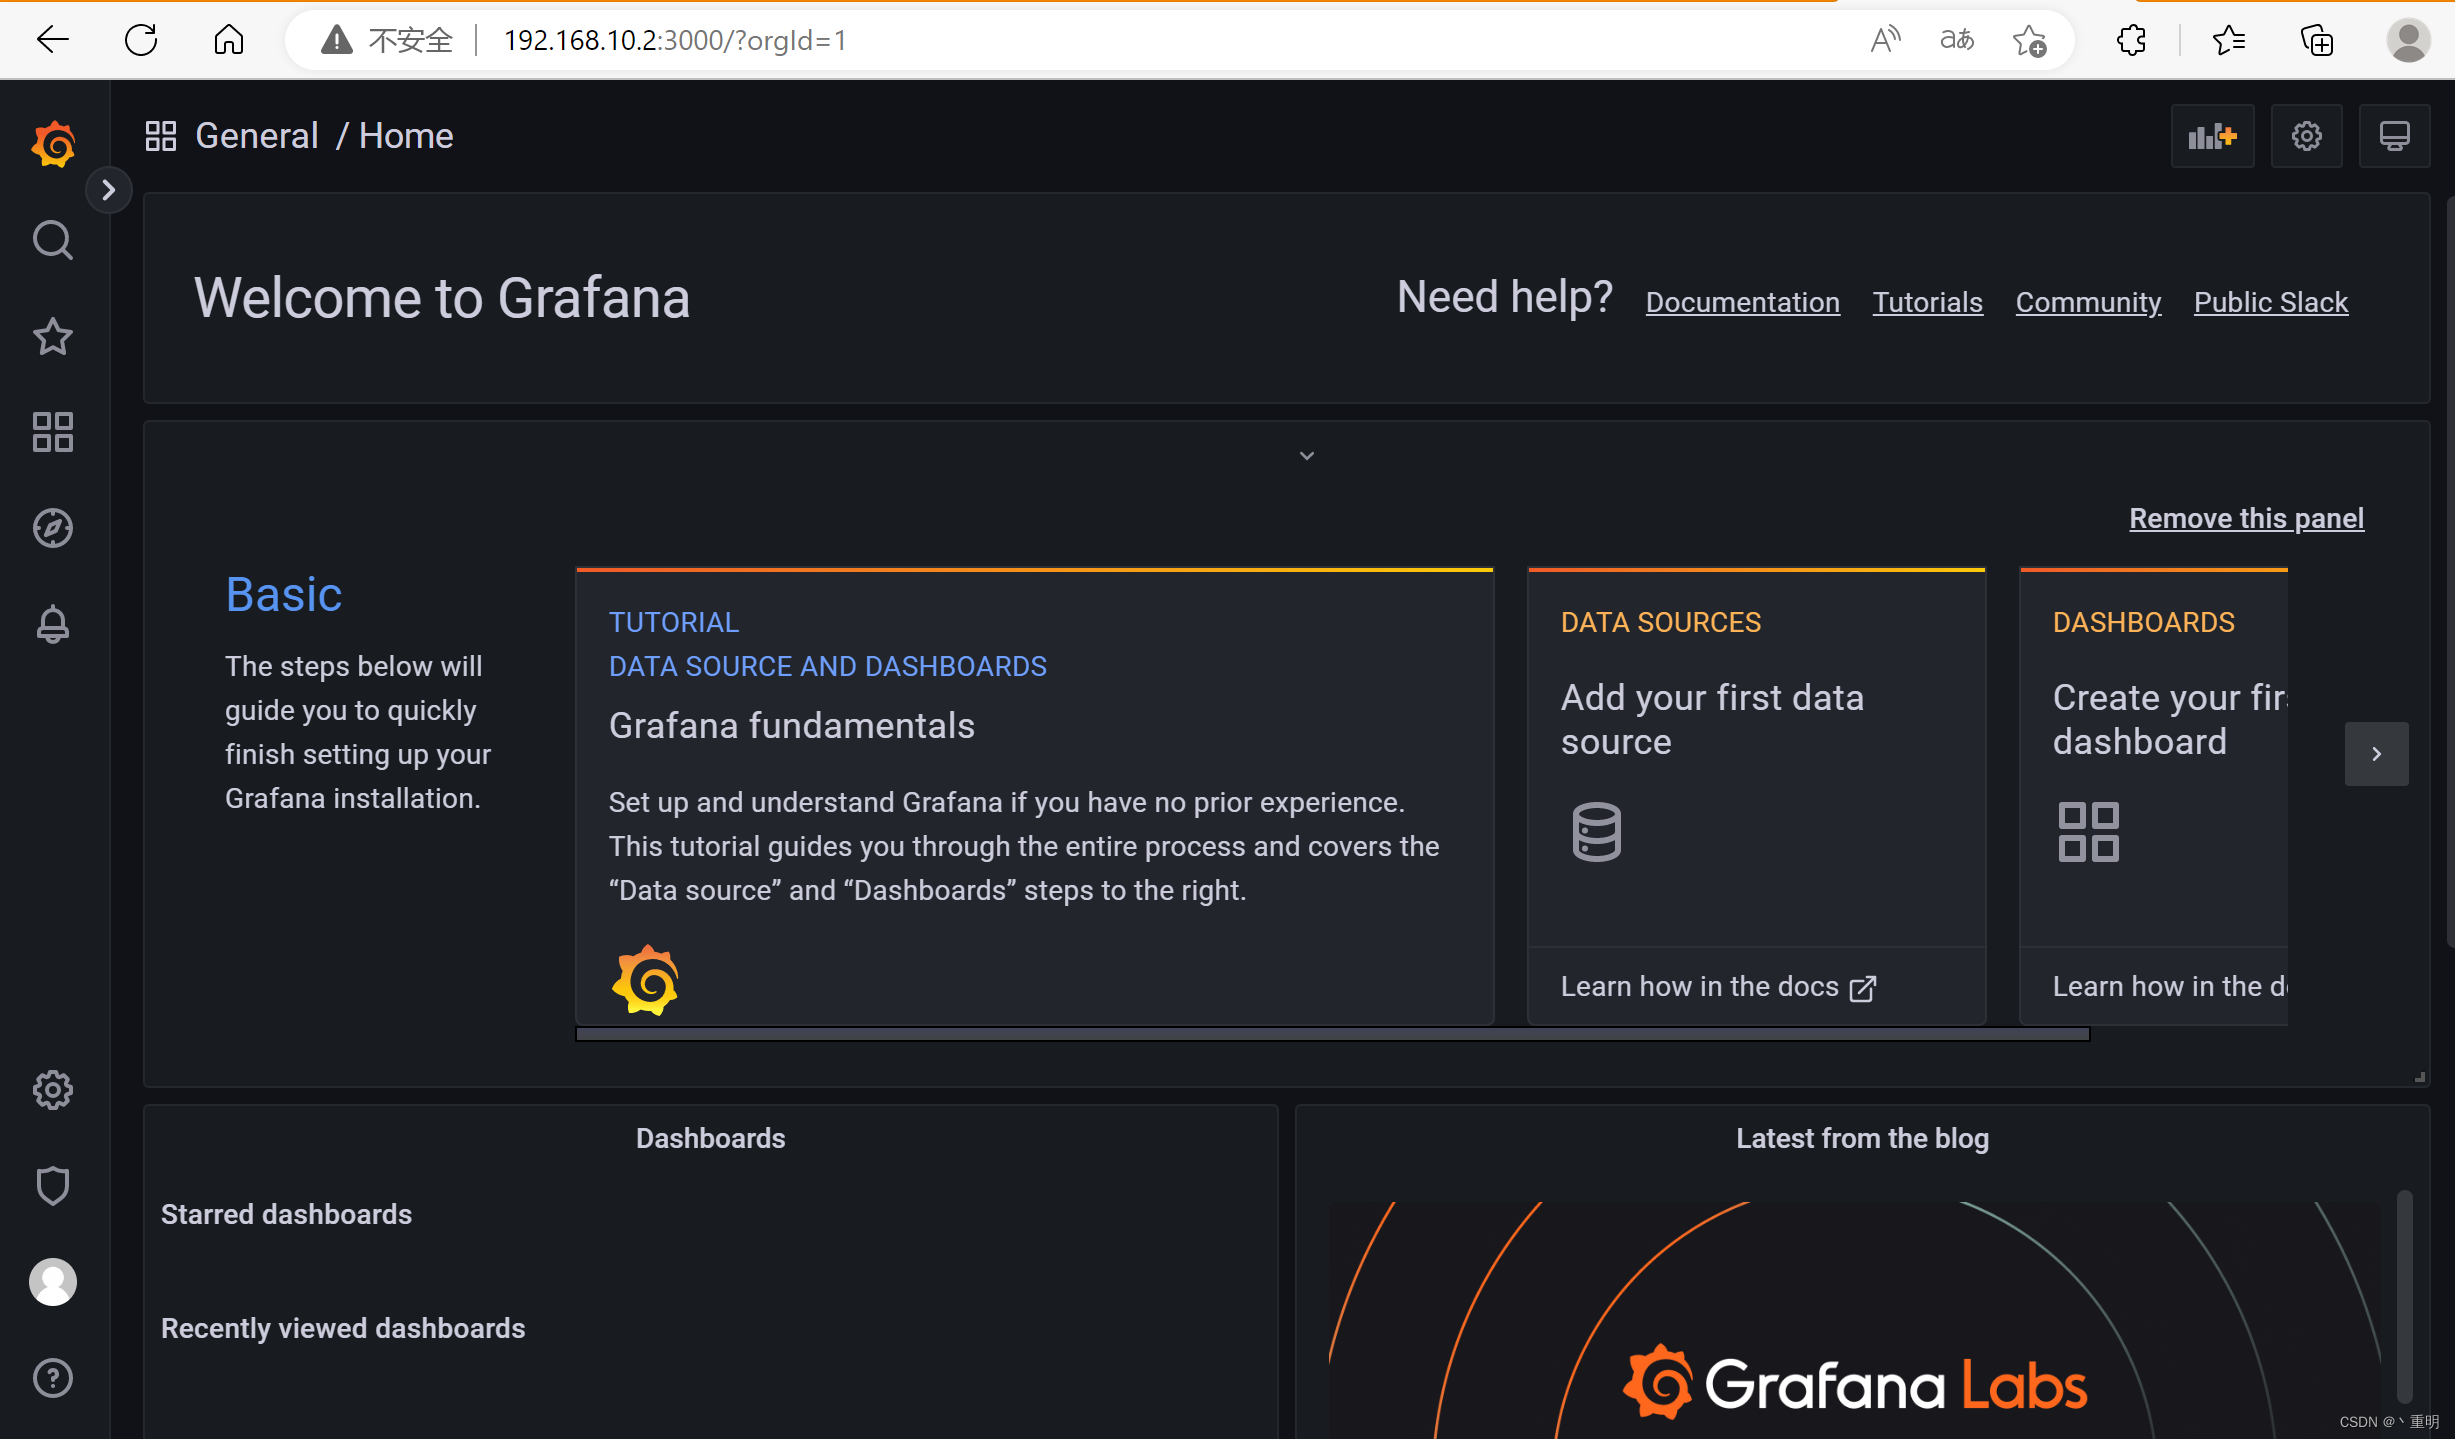
- 启动服务,通过浏览器访问(http://ip:3000)(用户名/密码:admin/admin)
[root@localhost ~]# systemctl start grafana-server.service
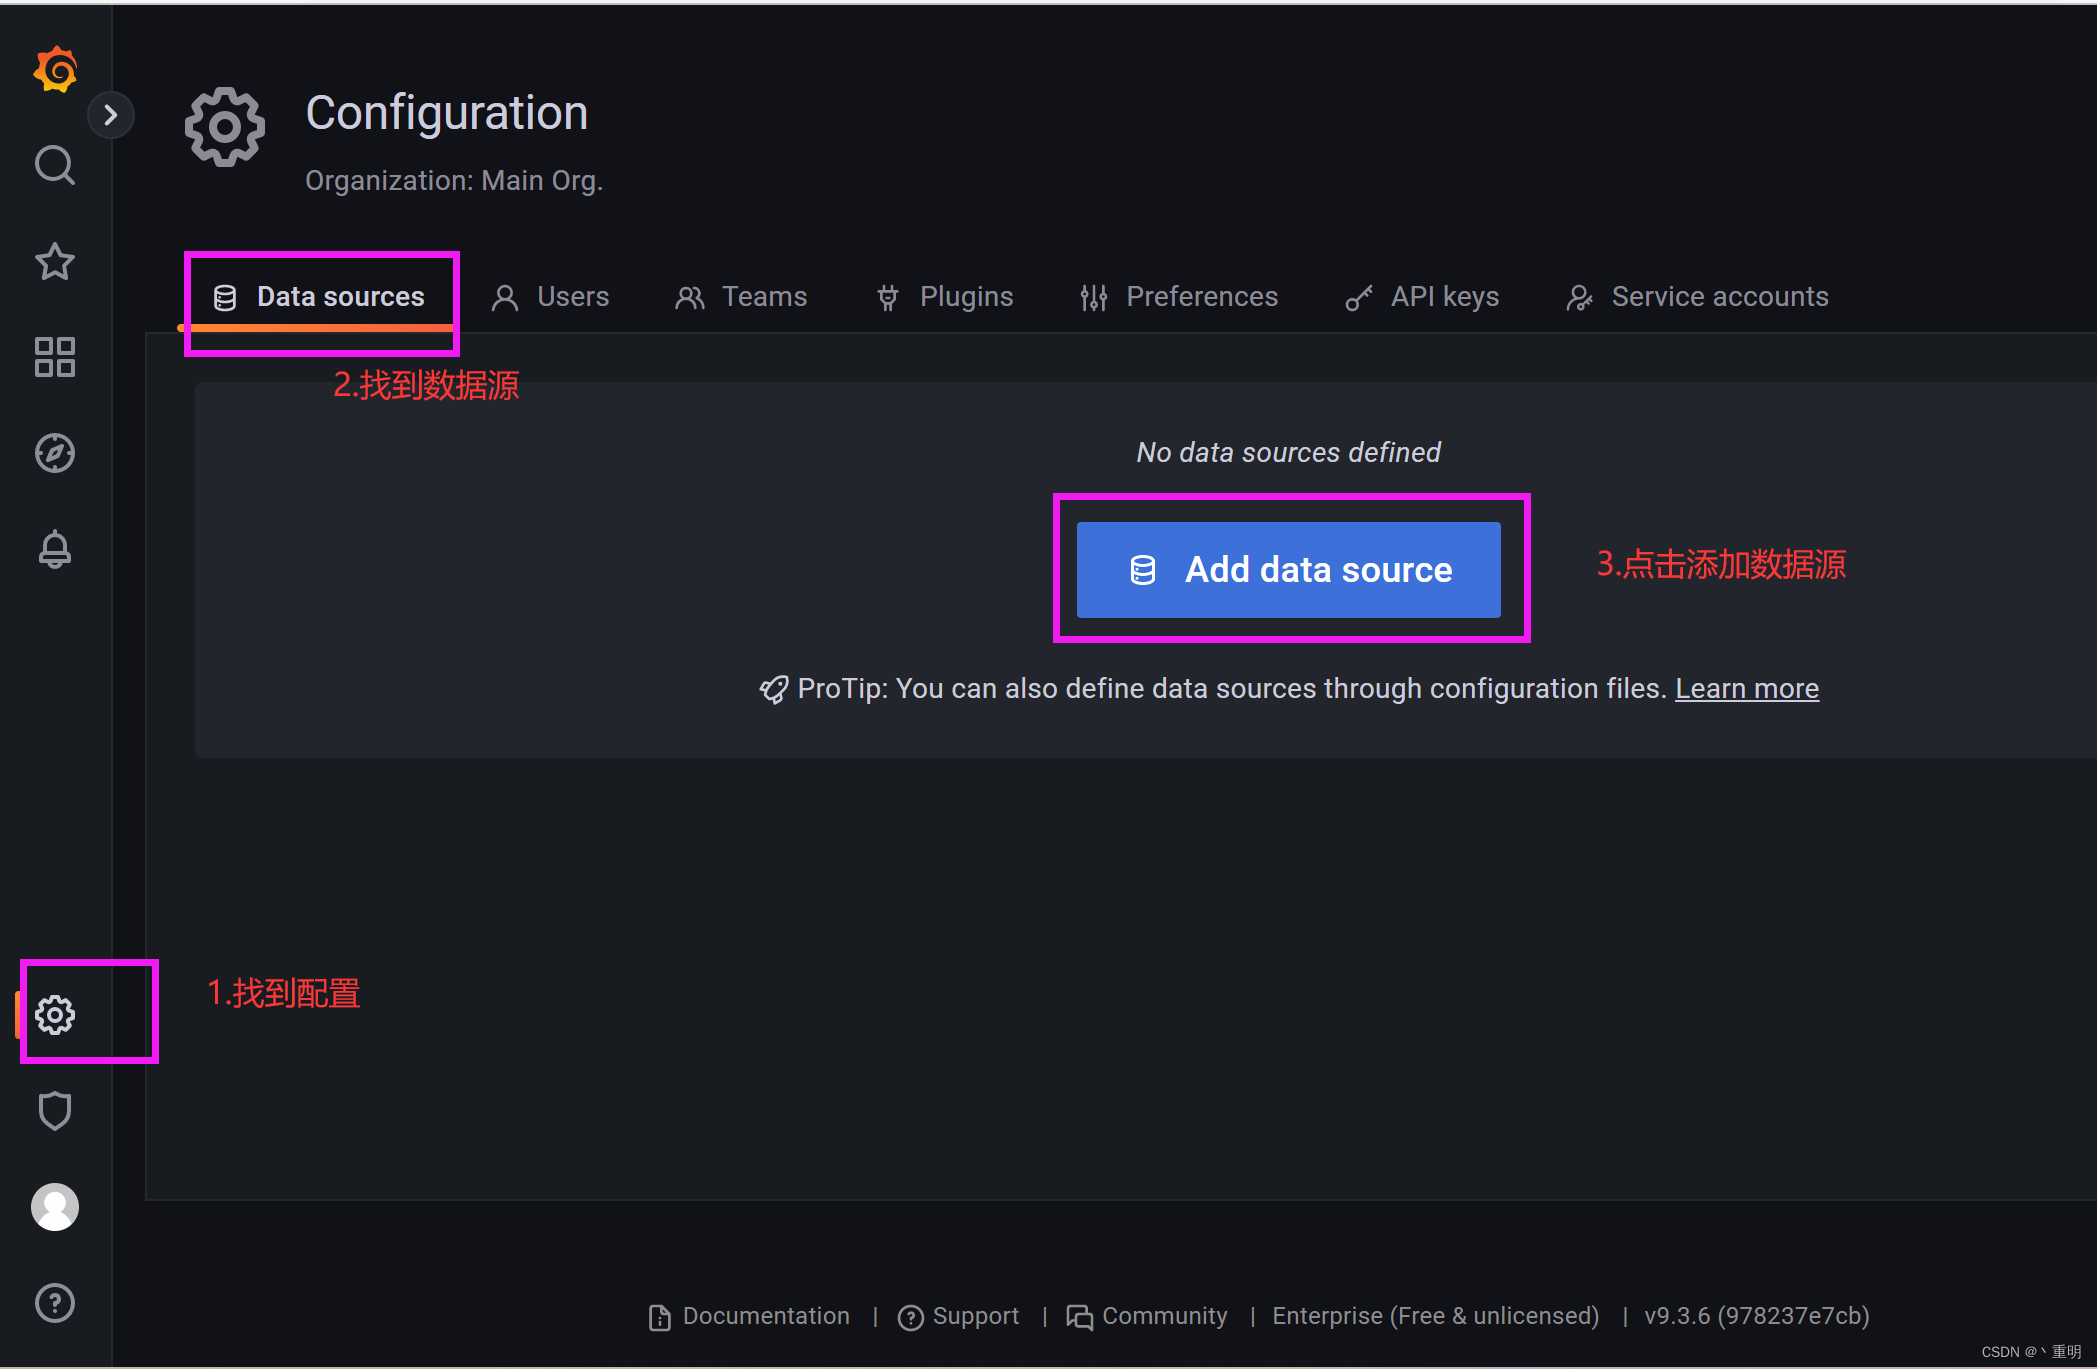
- 配置将prometheus作为数据源
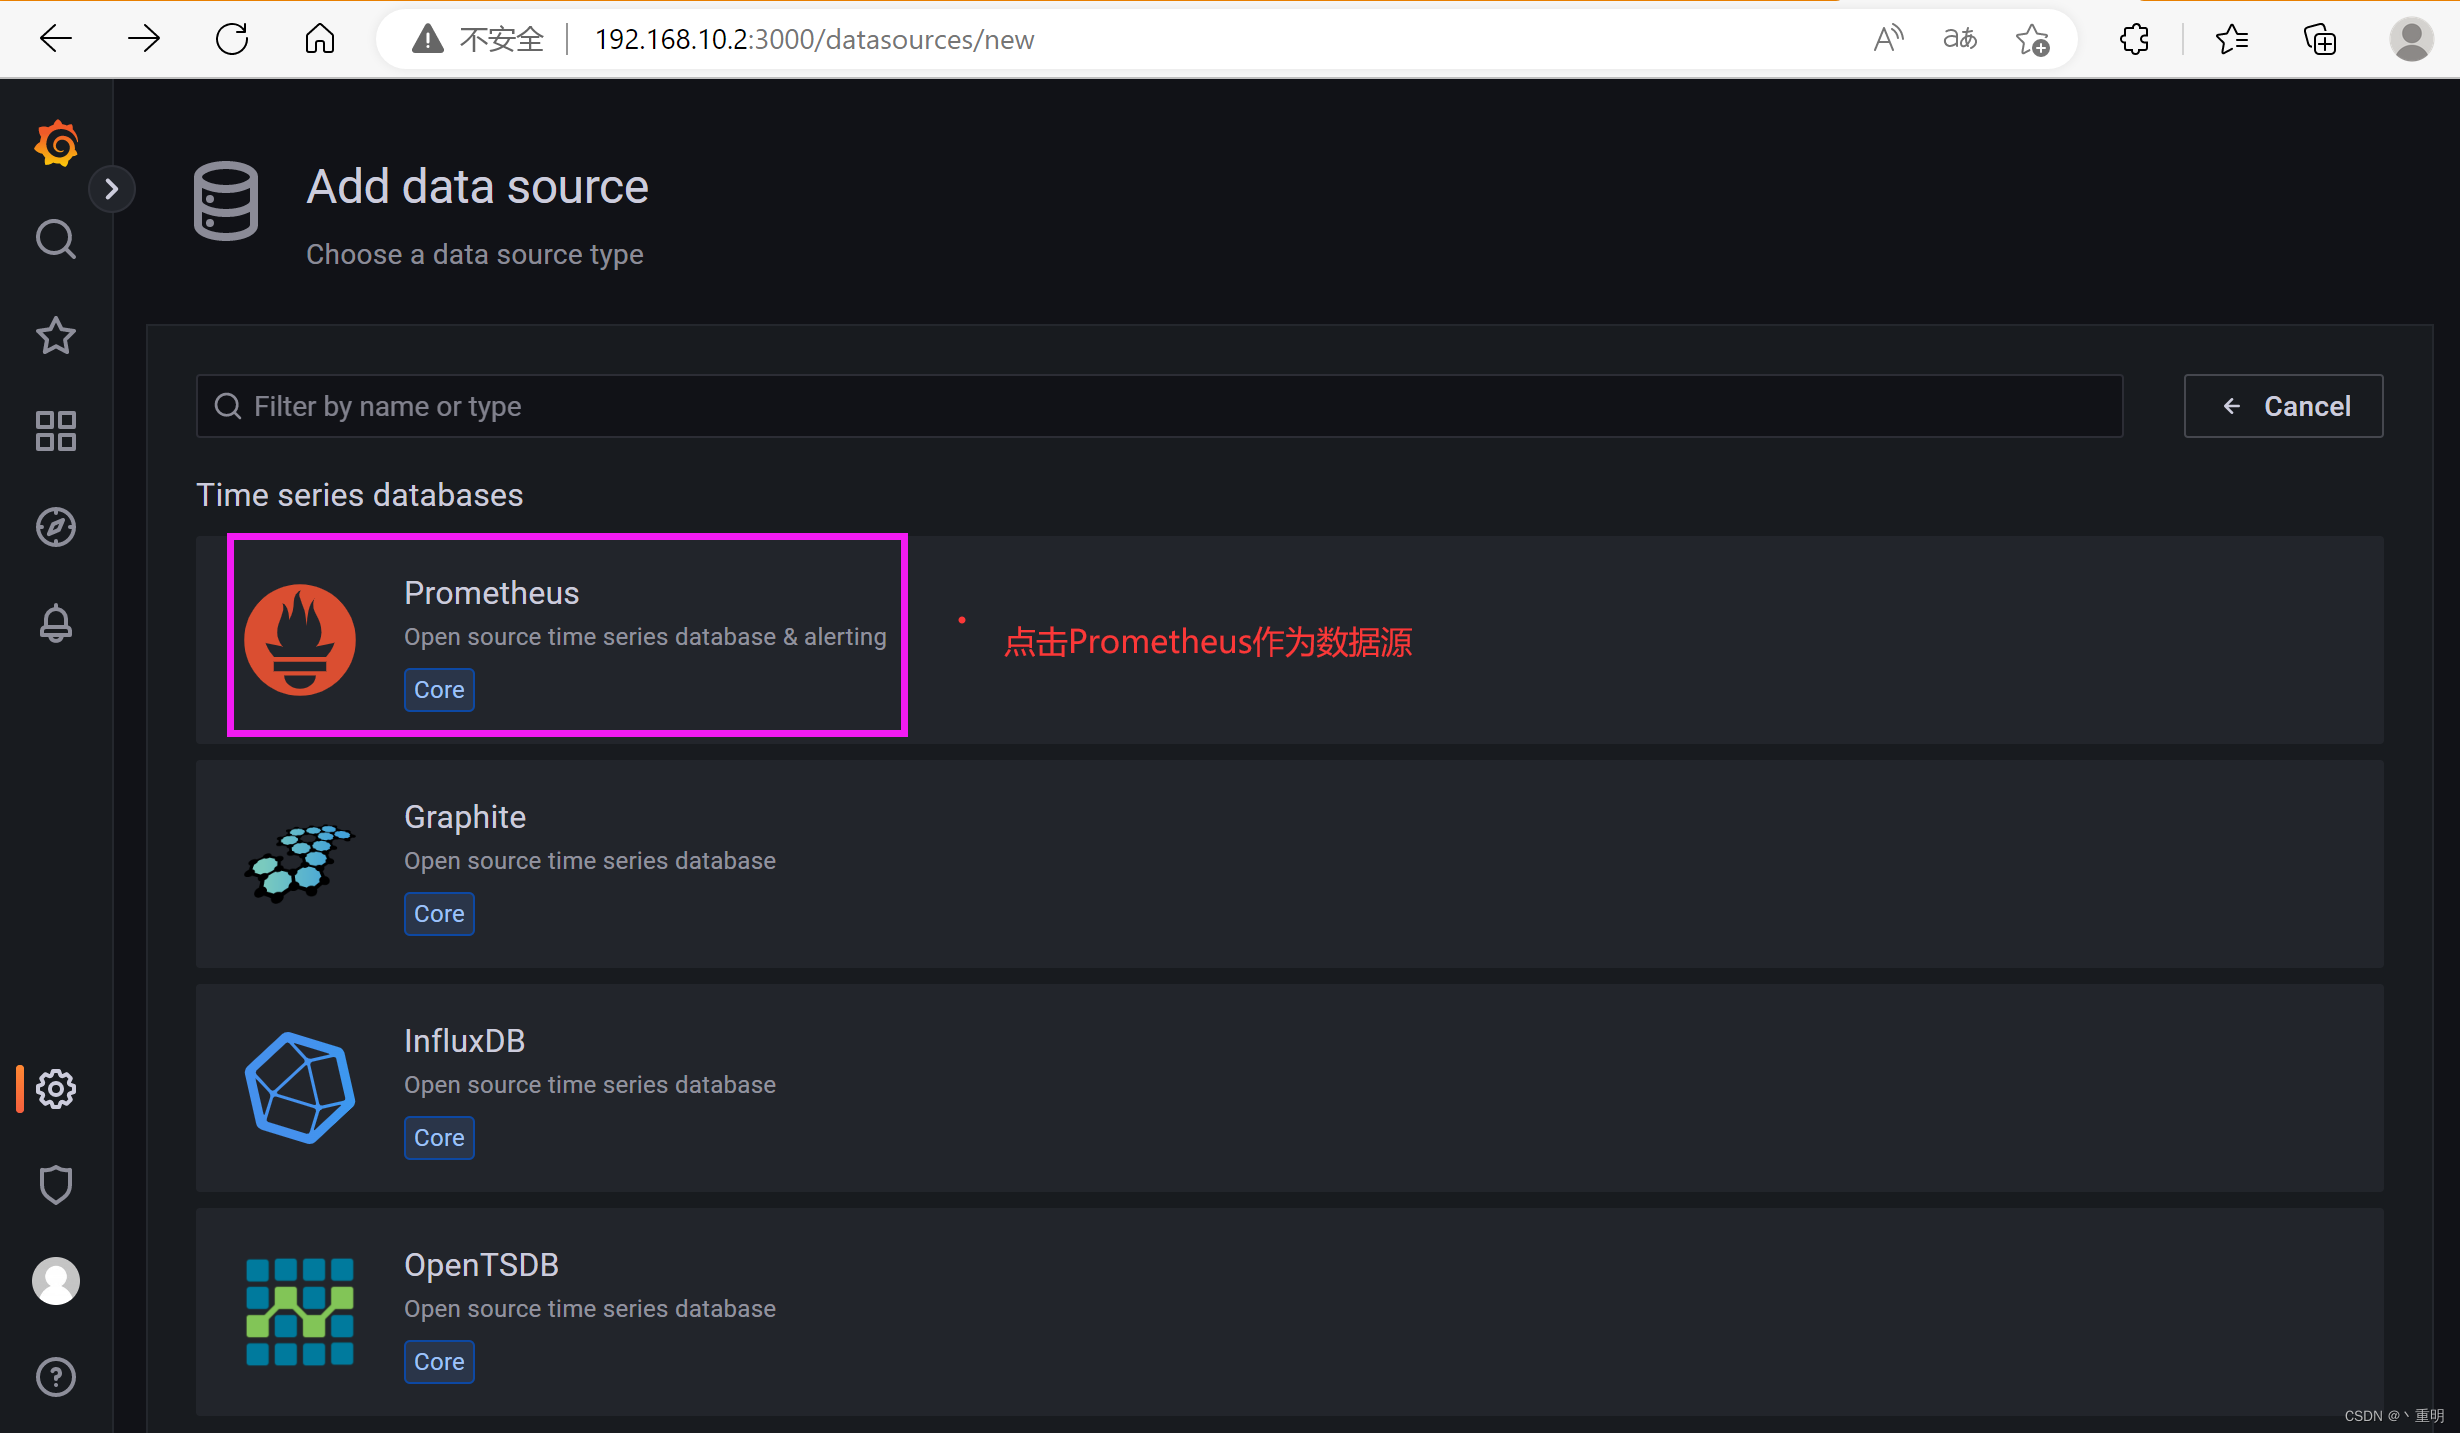
- 输入prometheus的url,别的暂时使用默认,在最下面找到保存点击(注意如果不加http://可能会报错)
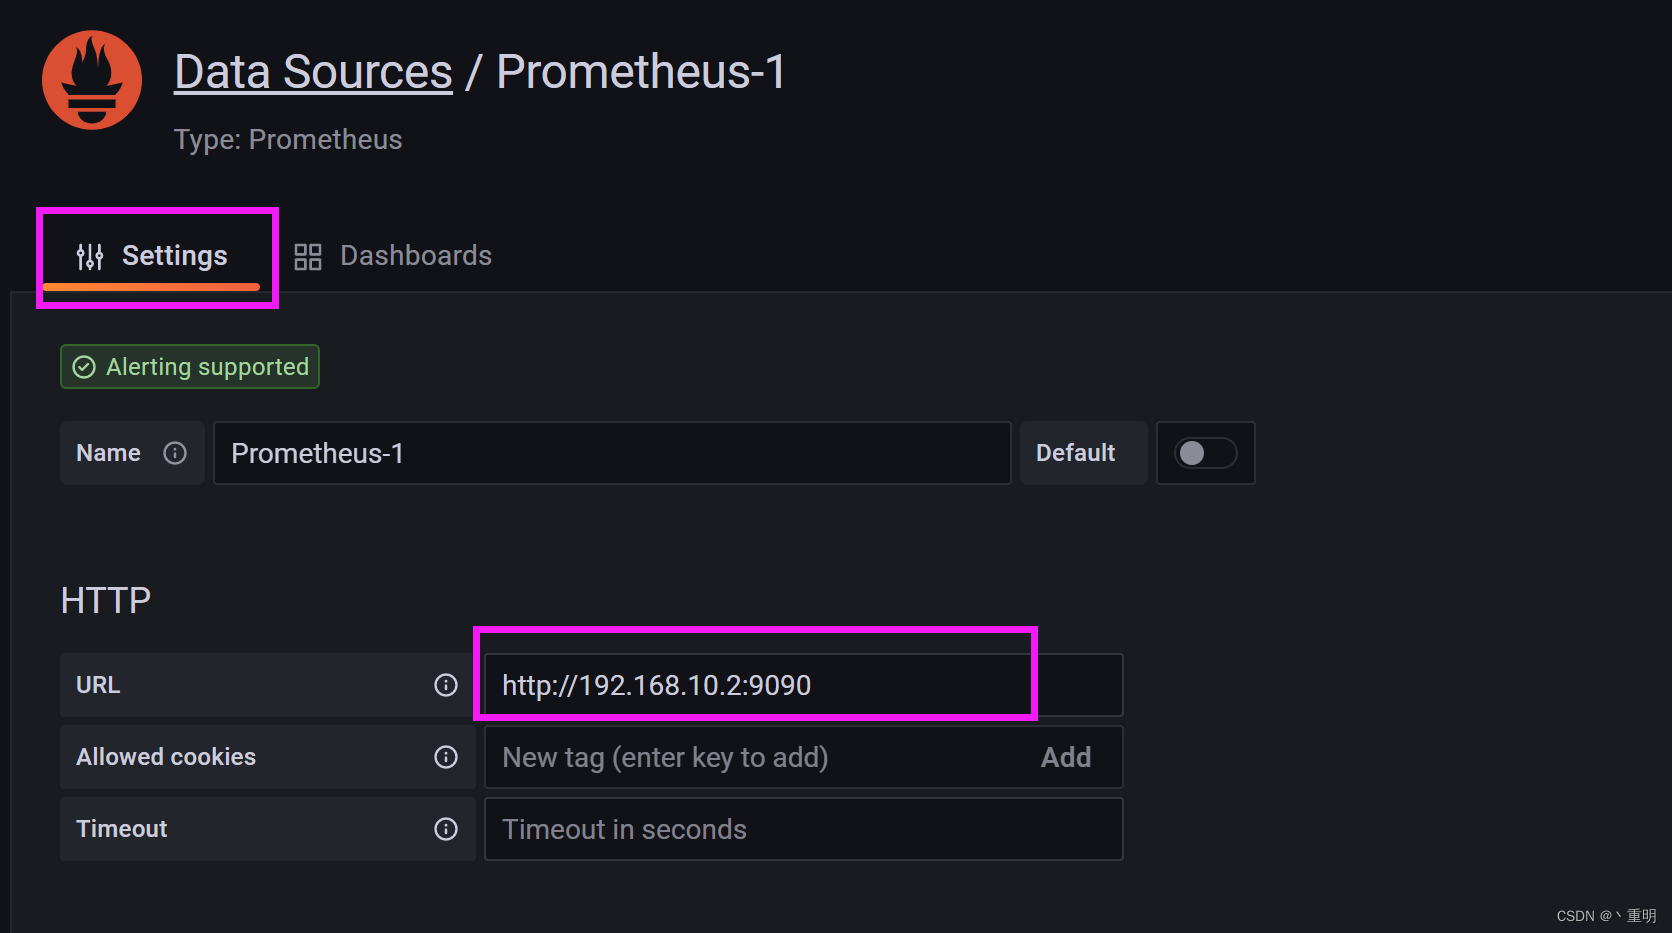
- 导入prometheus 仪表盘
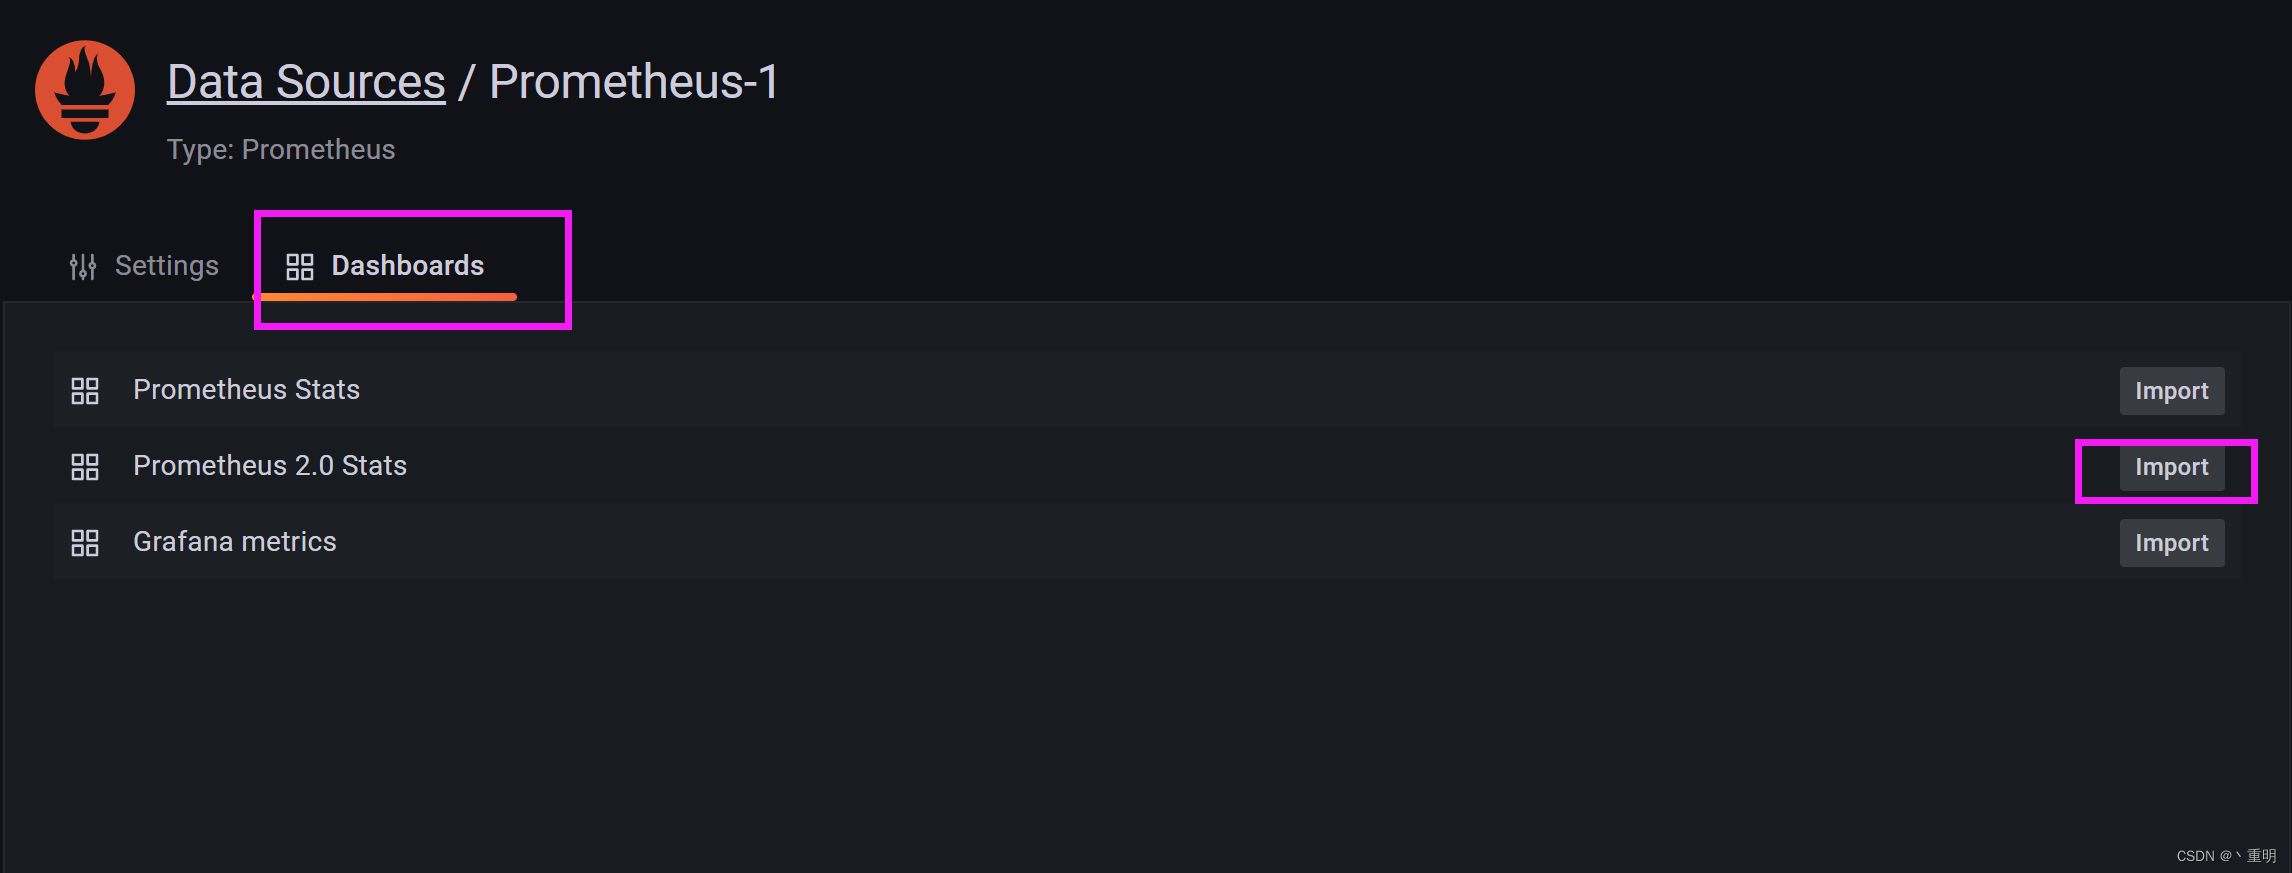
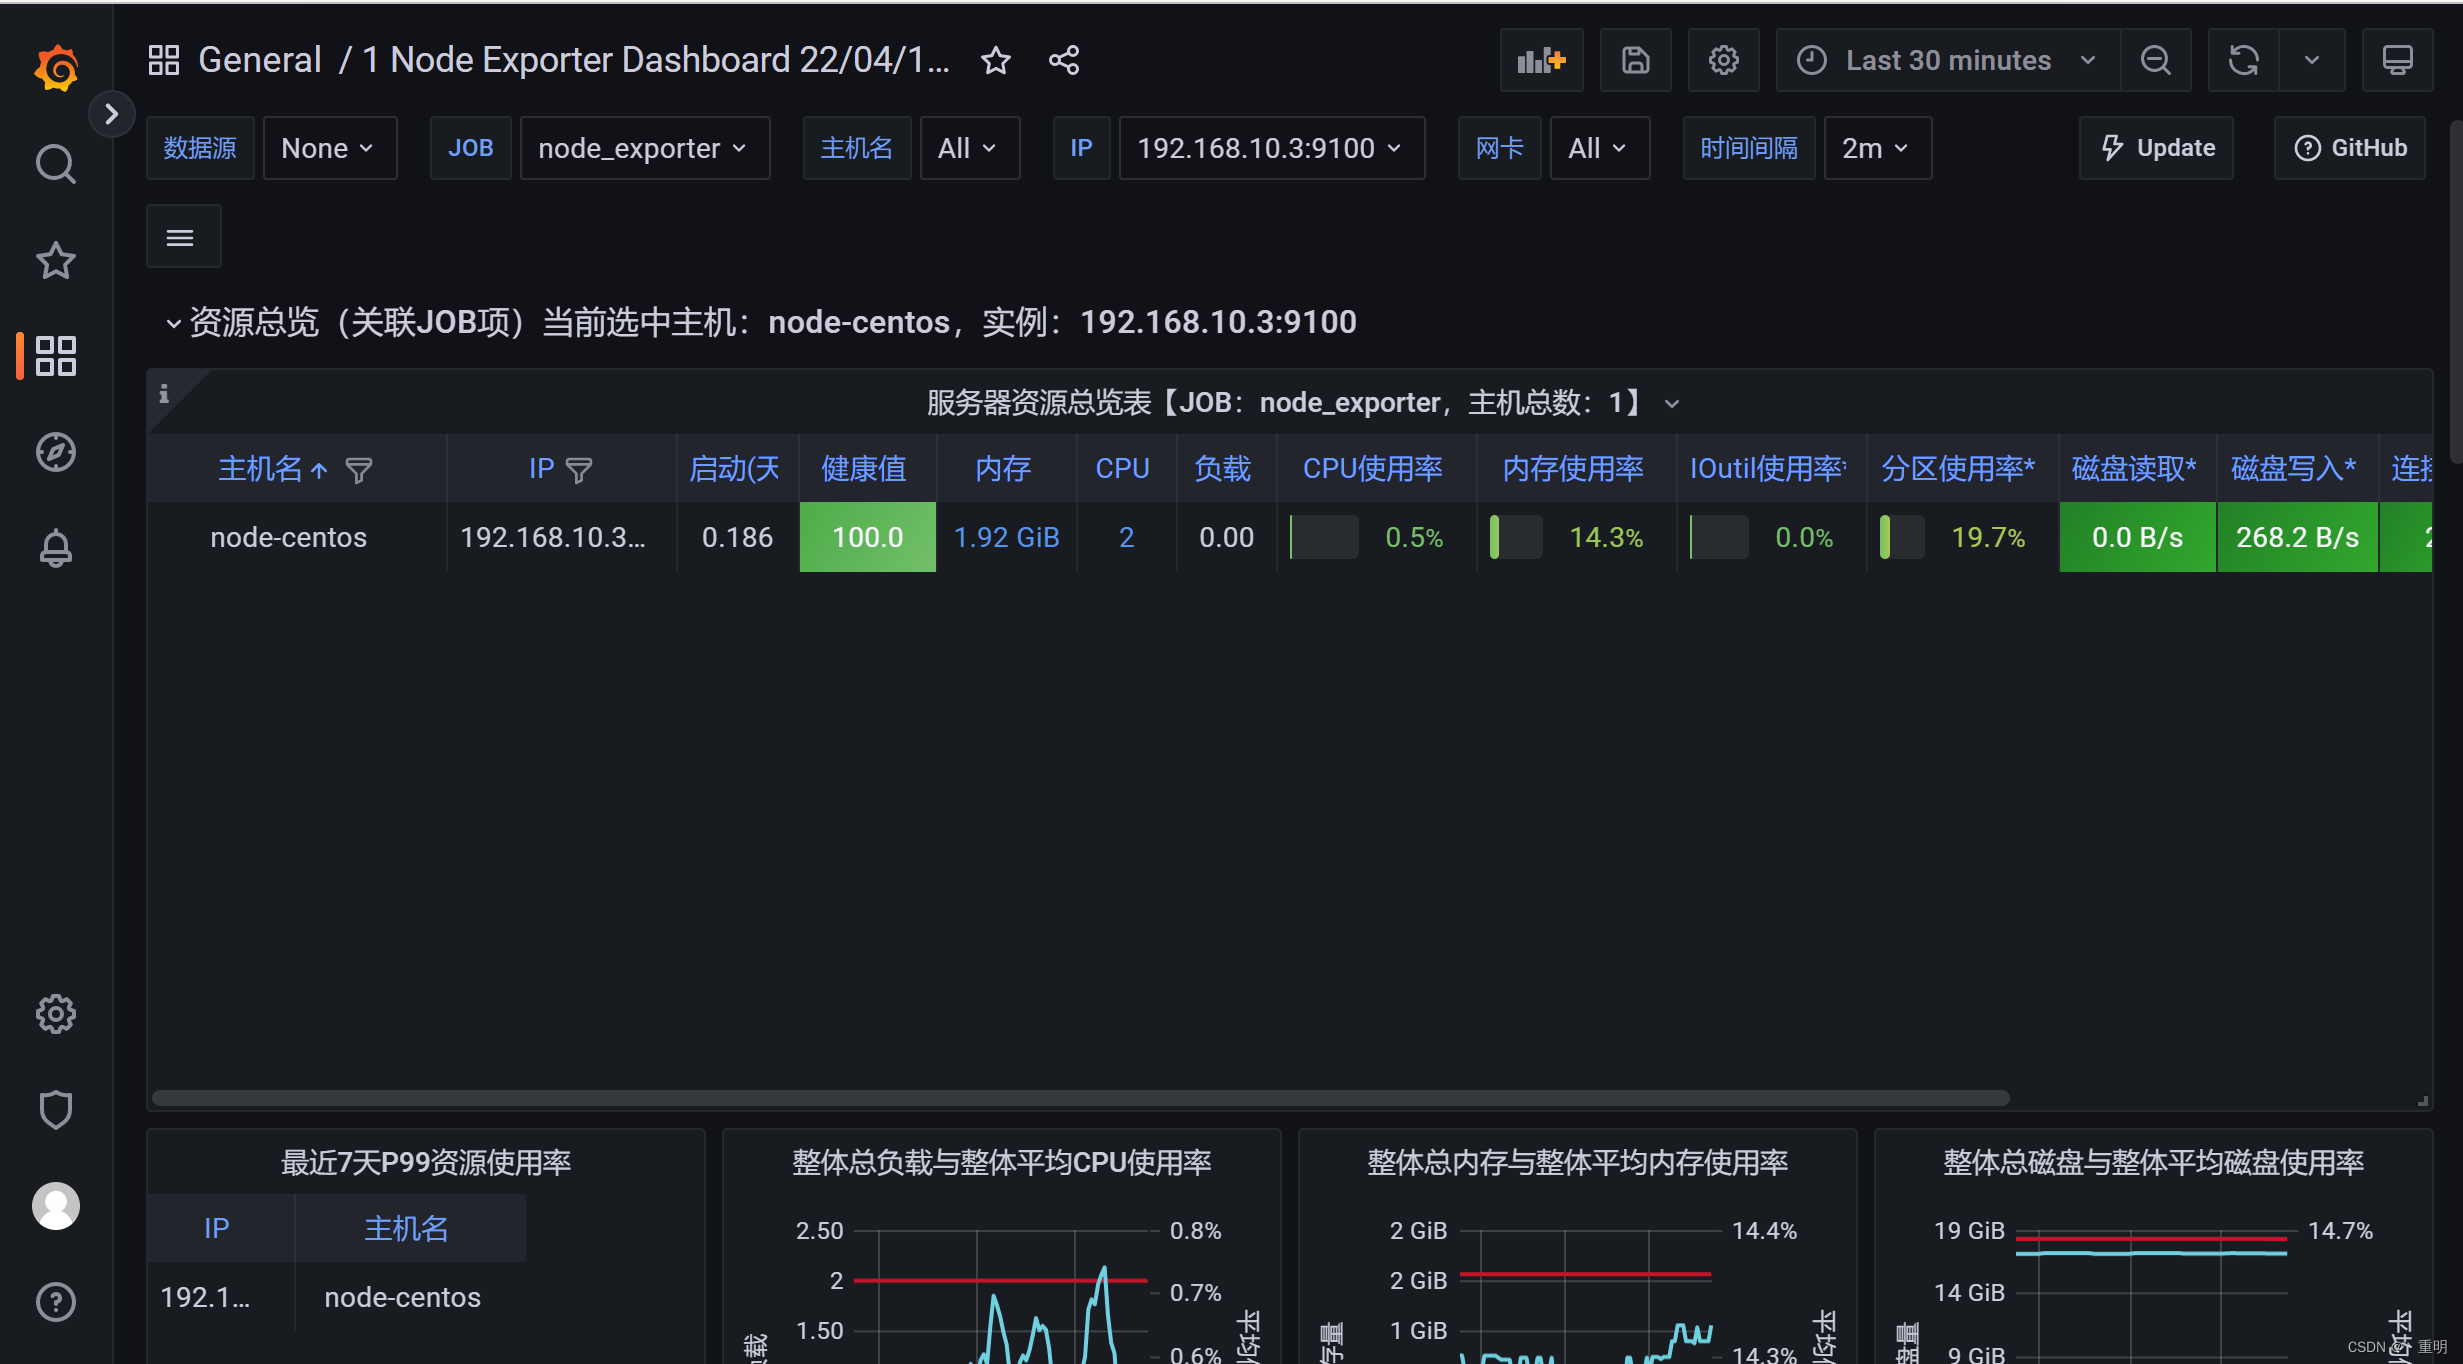
- 仪表盘展示
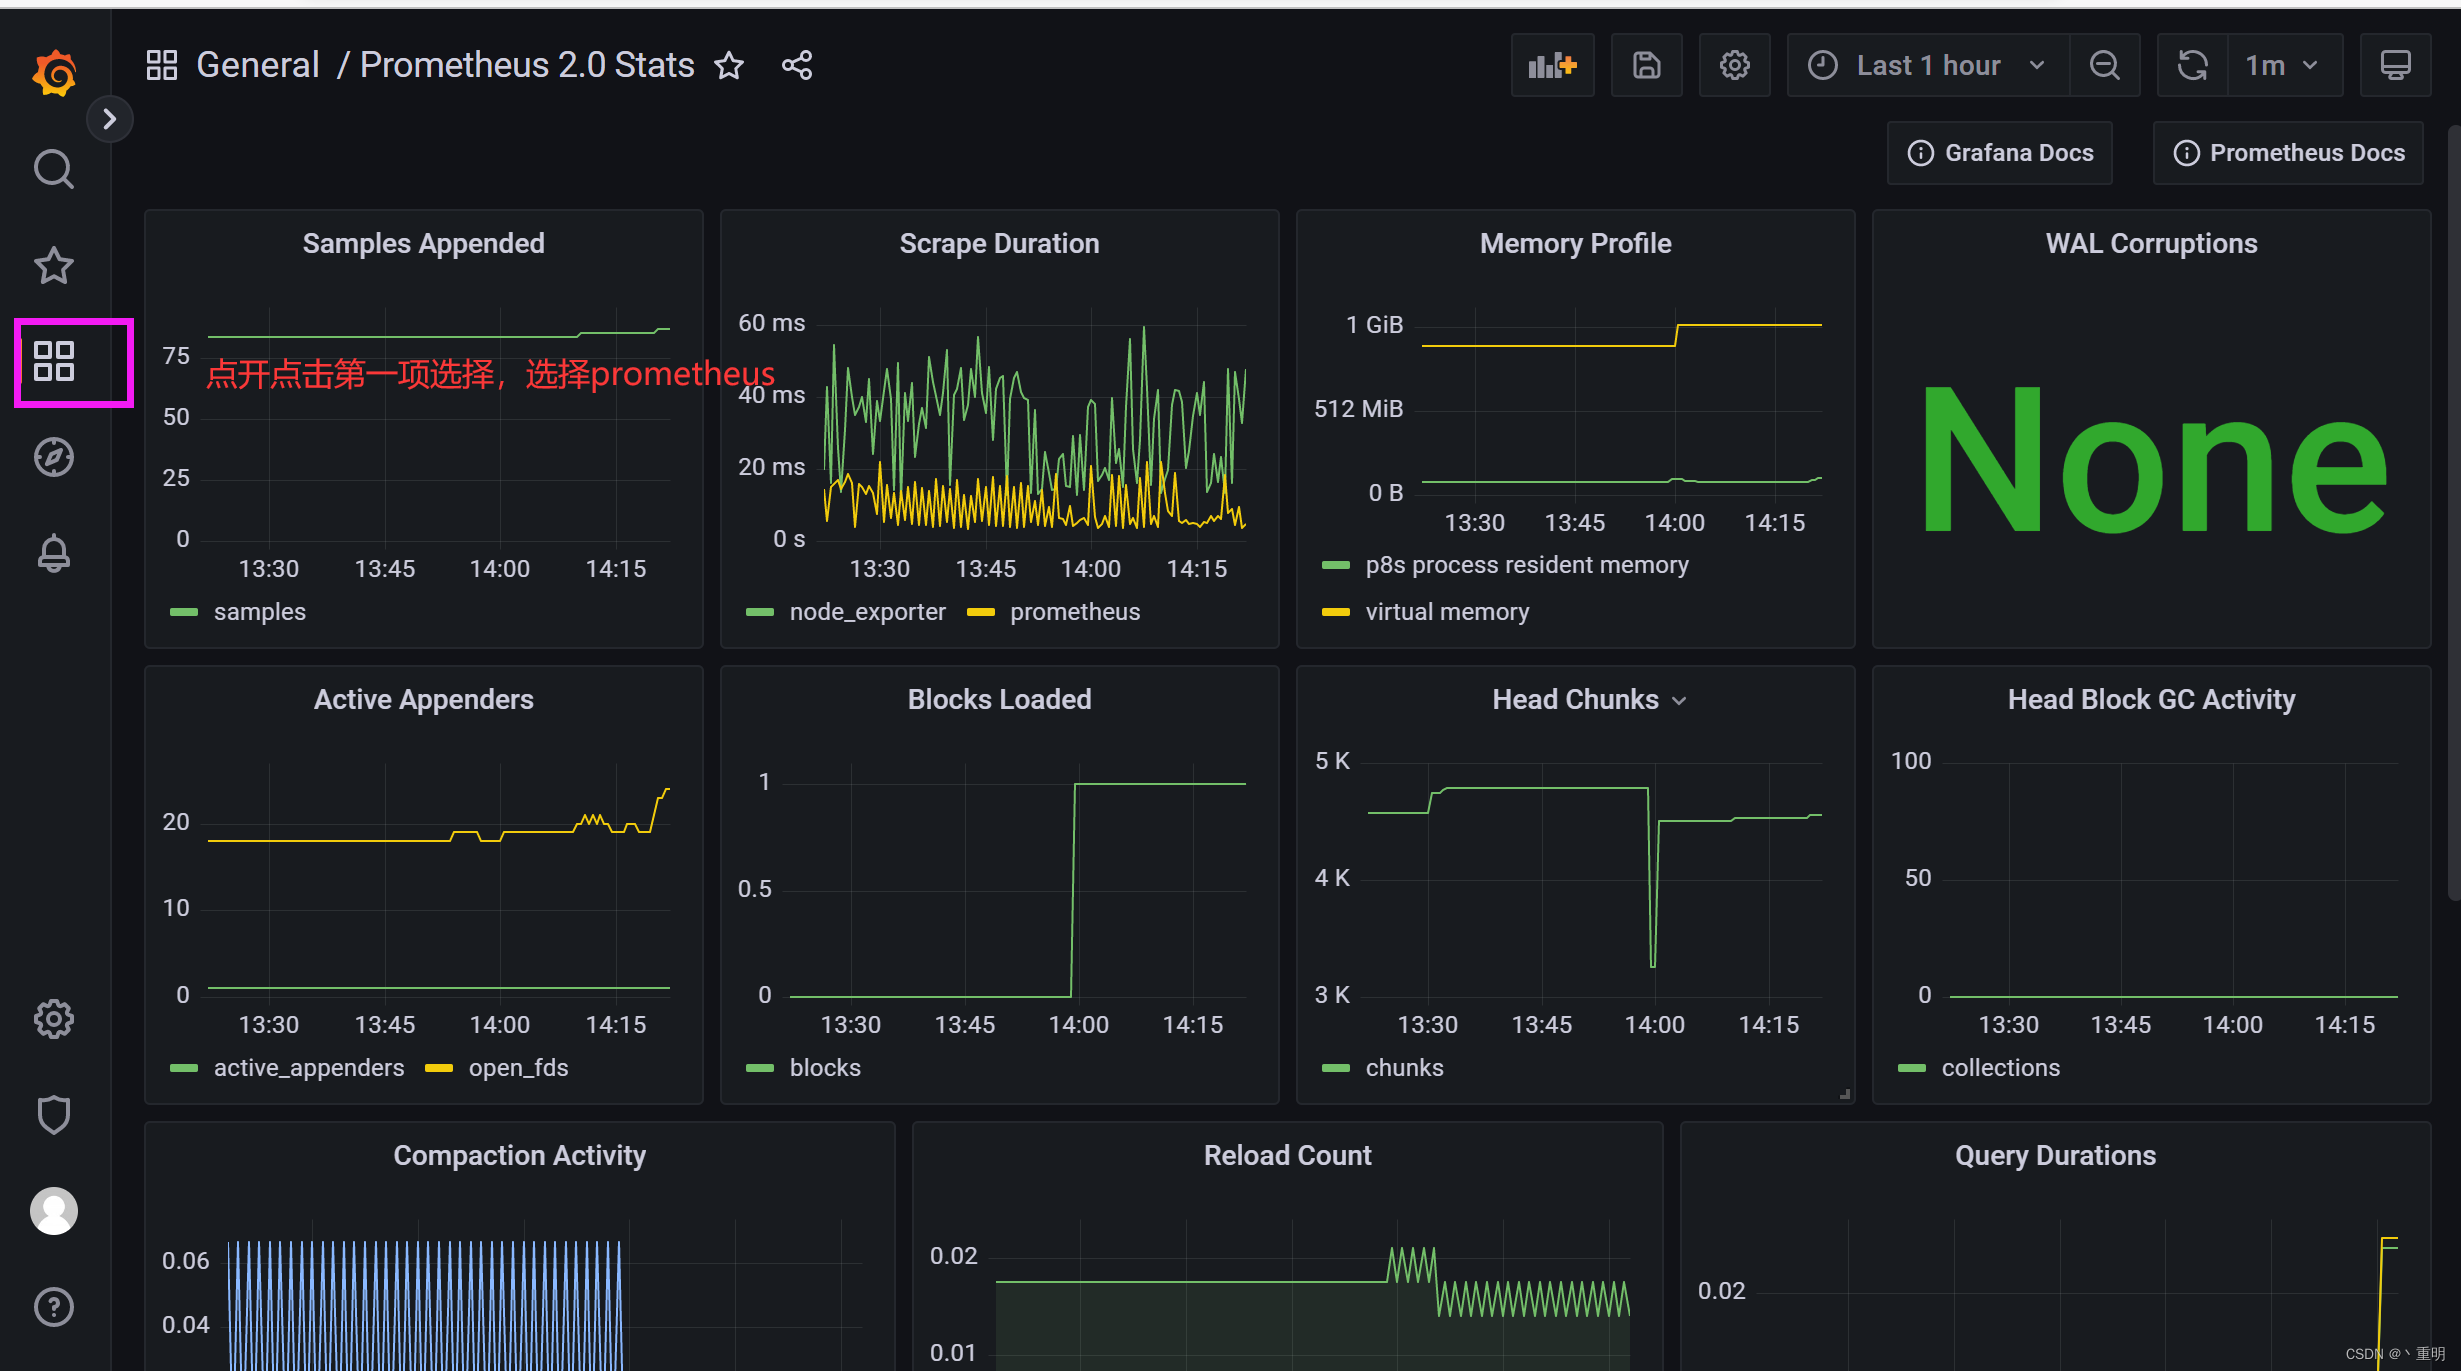
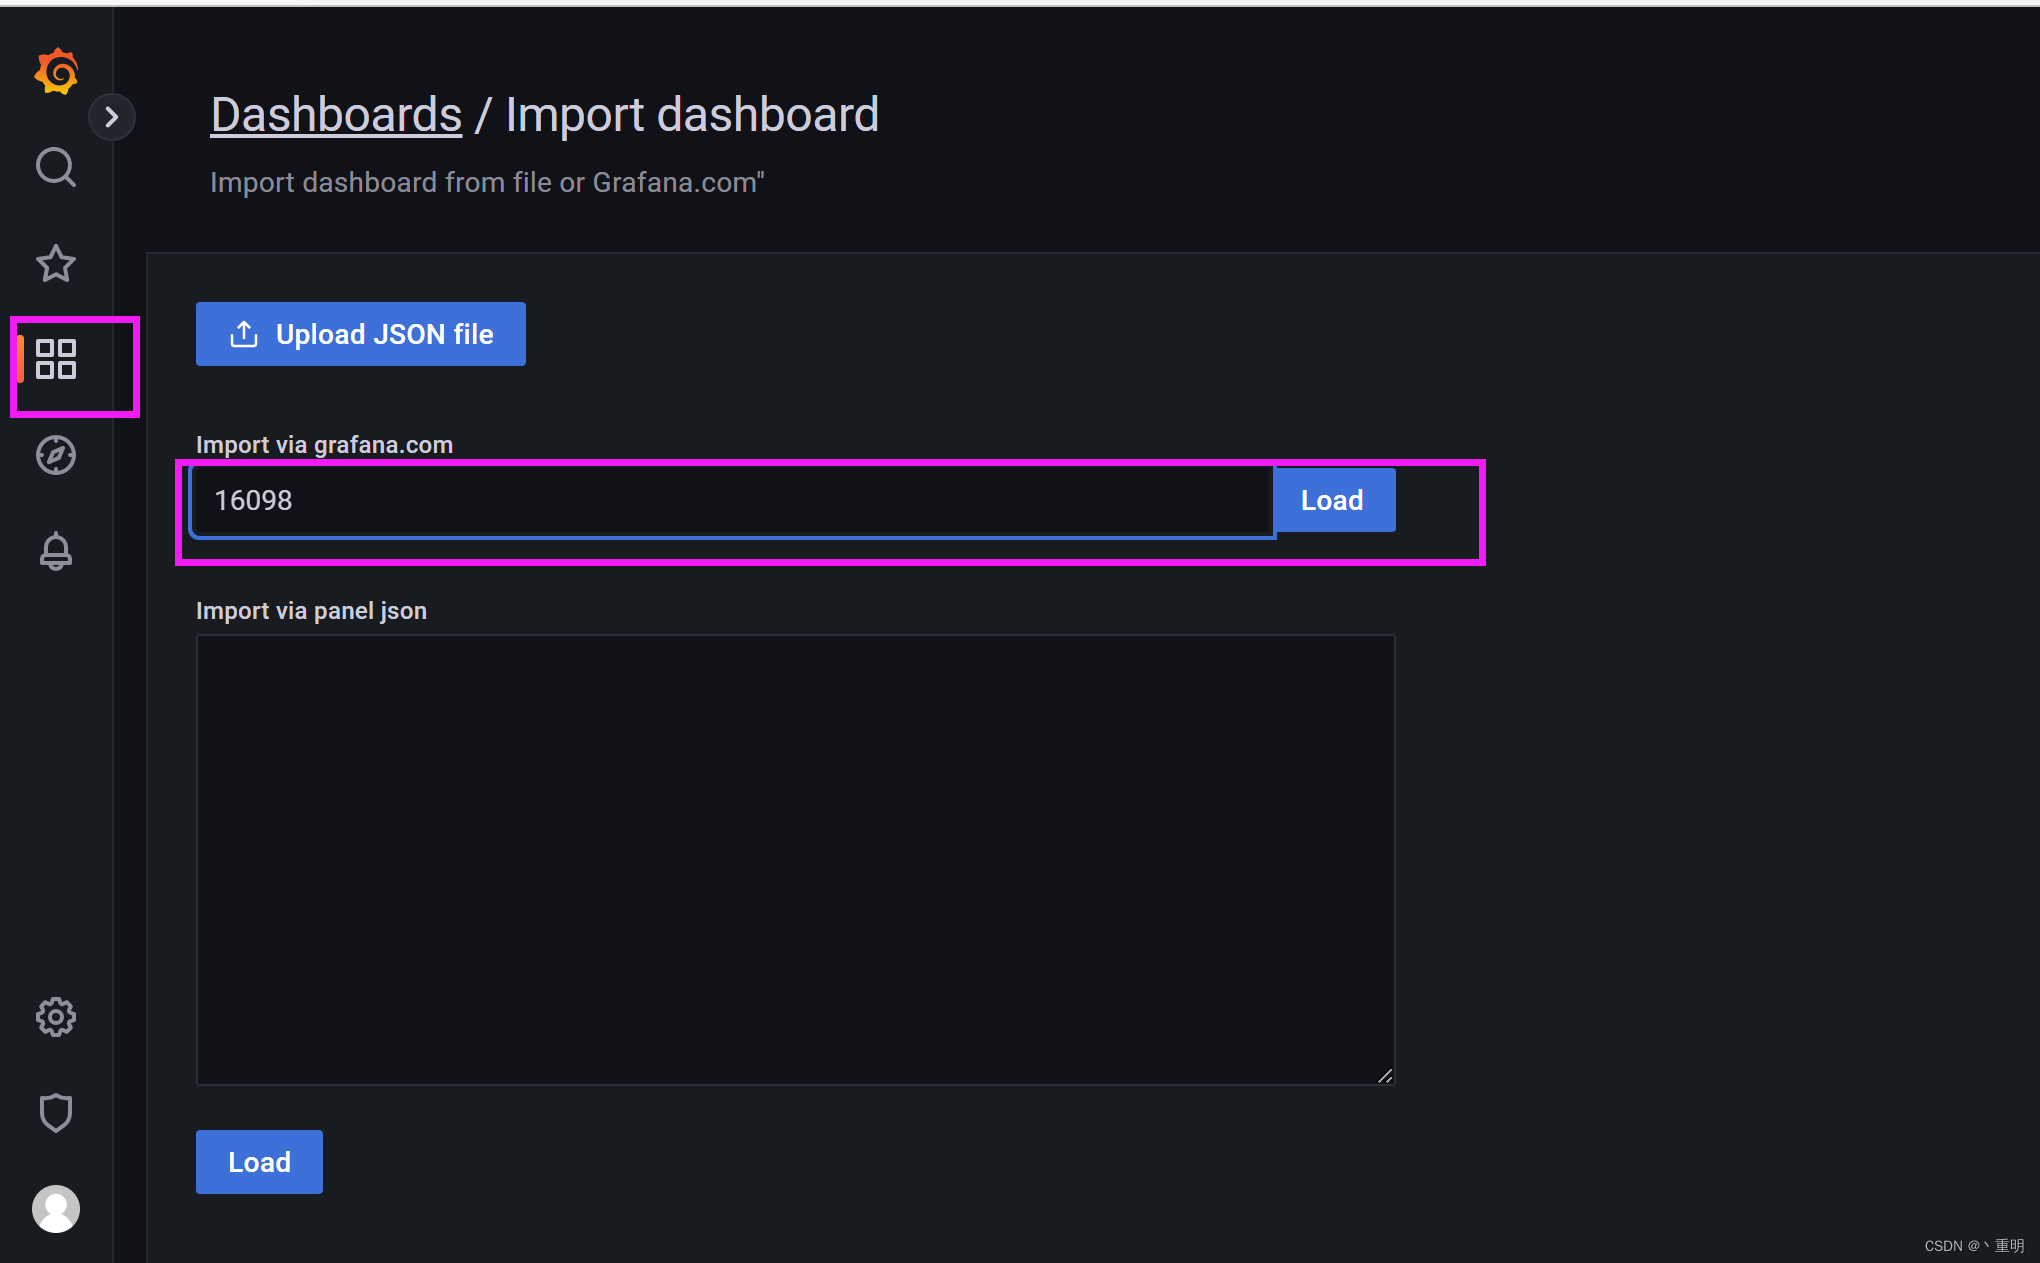
4.导入node_exporter模板监控node节点
- 安装饼图插件
[root@localhost ~]# grafana-cli plugins install grafana-piechart-panel
[root@localhost ~]# systemctl restart grafana-server.service
- 点击小方块——点击Import——输入ID——点击load——选择prometheus——点击Import

- 数据太少也可以在服务端装上node_exporter加入到监控中,重复第二步,在配置文件中写在10.3下方
static_configs:- targets: ["192.168.10.3:9100"]- targets: ["192.168.10.2:9100"]
- 重启prometheus服务
[root@localhost prometheus]# systemctl restart prometheus.service
- 在网页grafana仪表盘中查看是否监控到节点
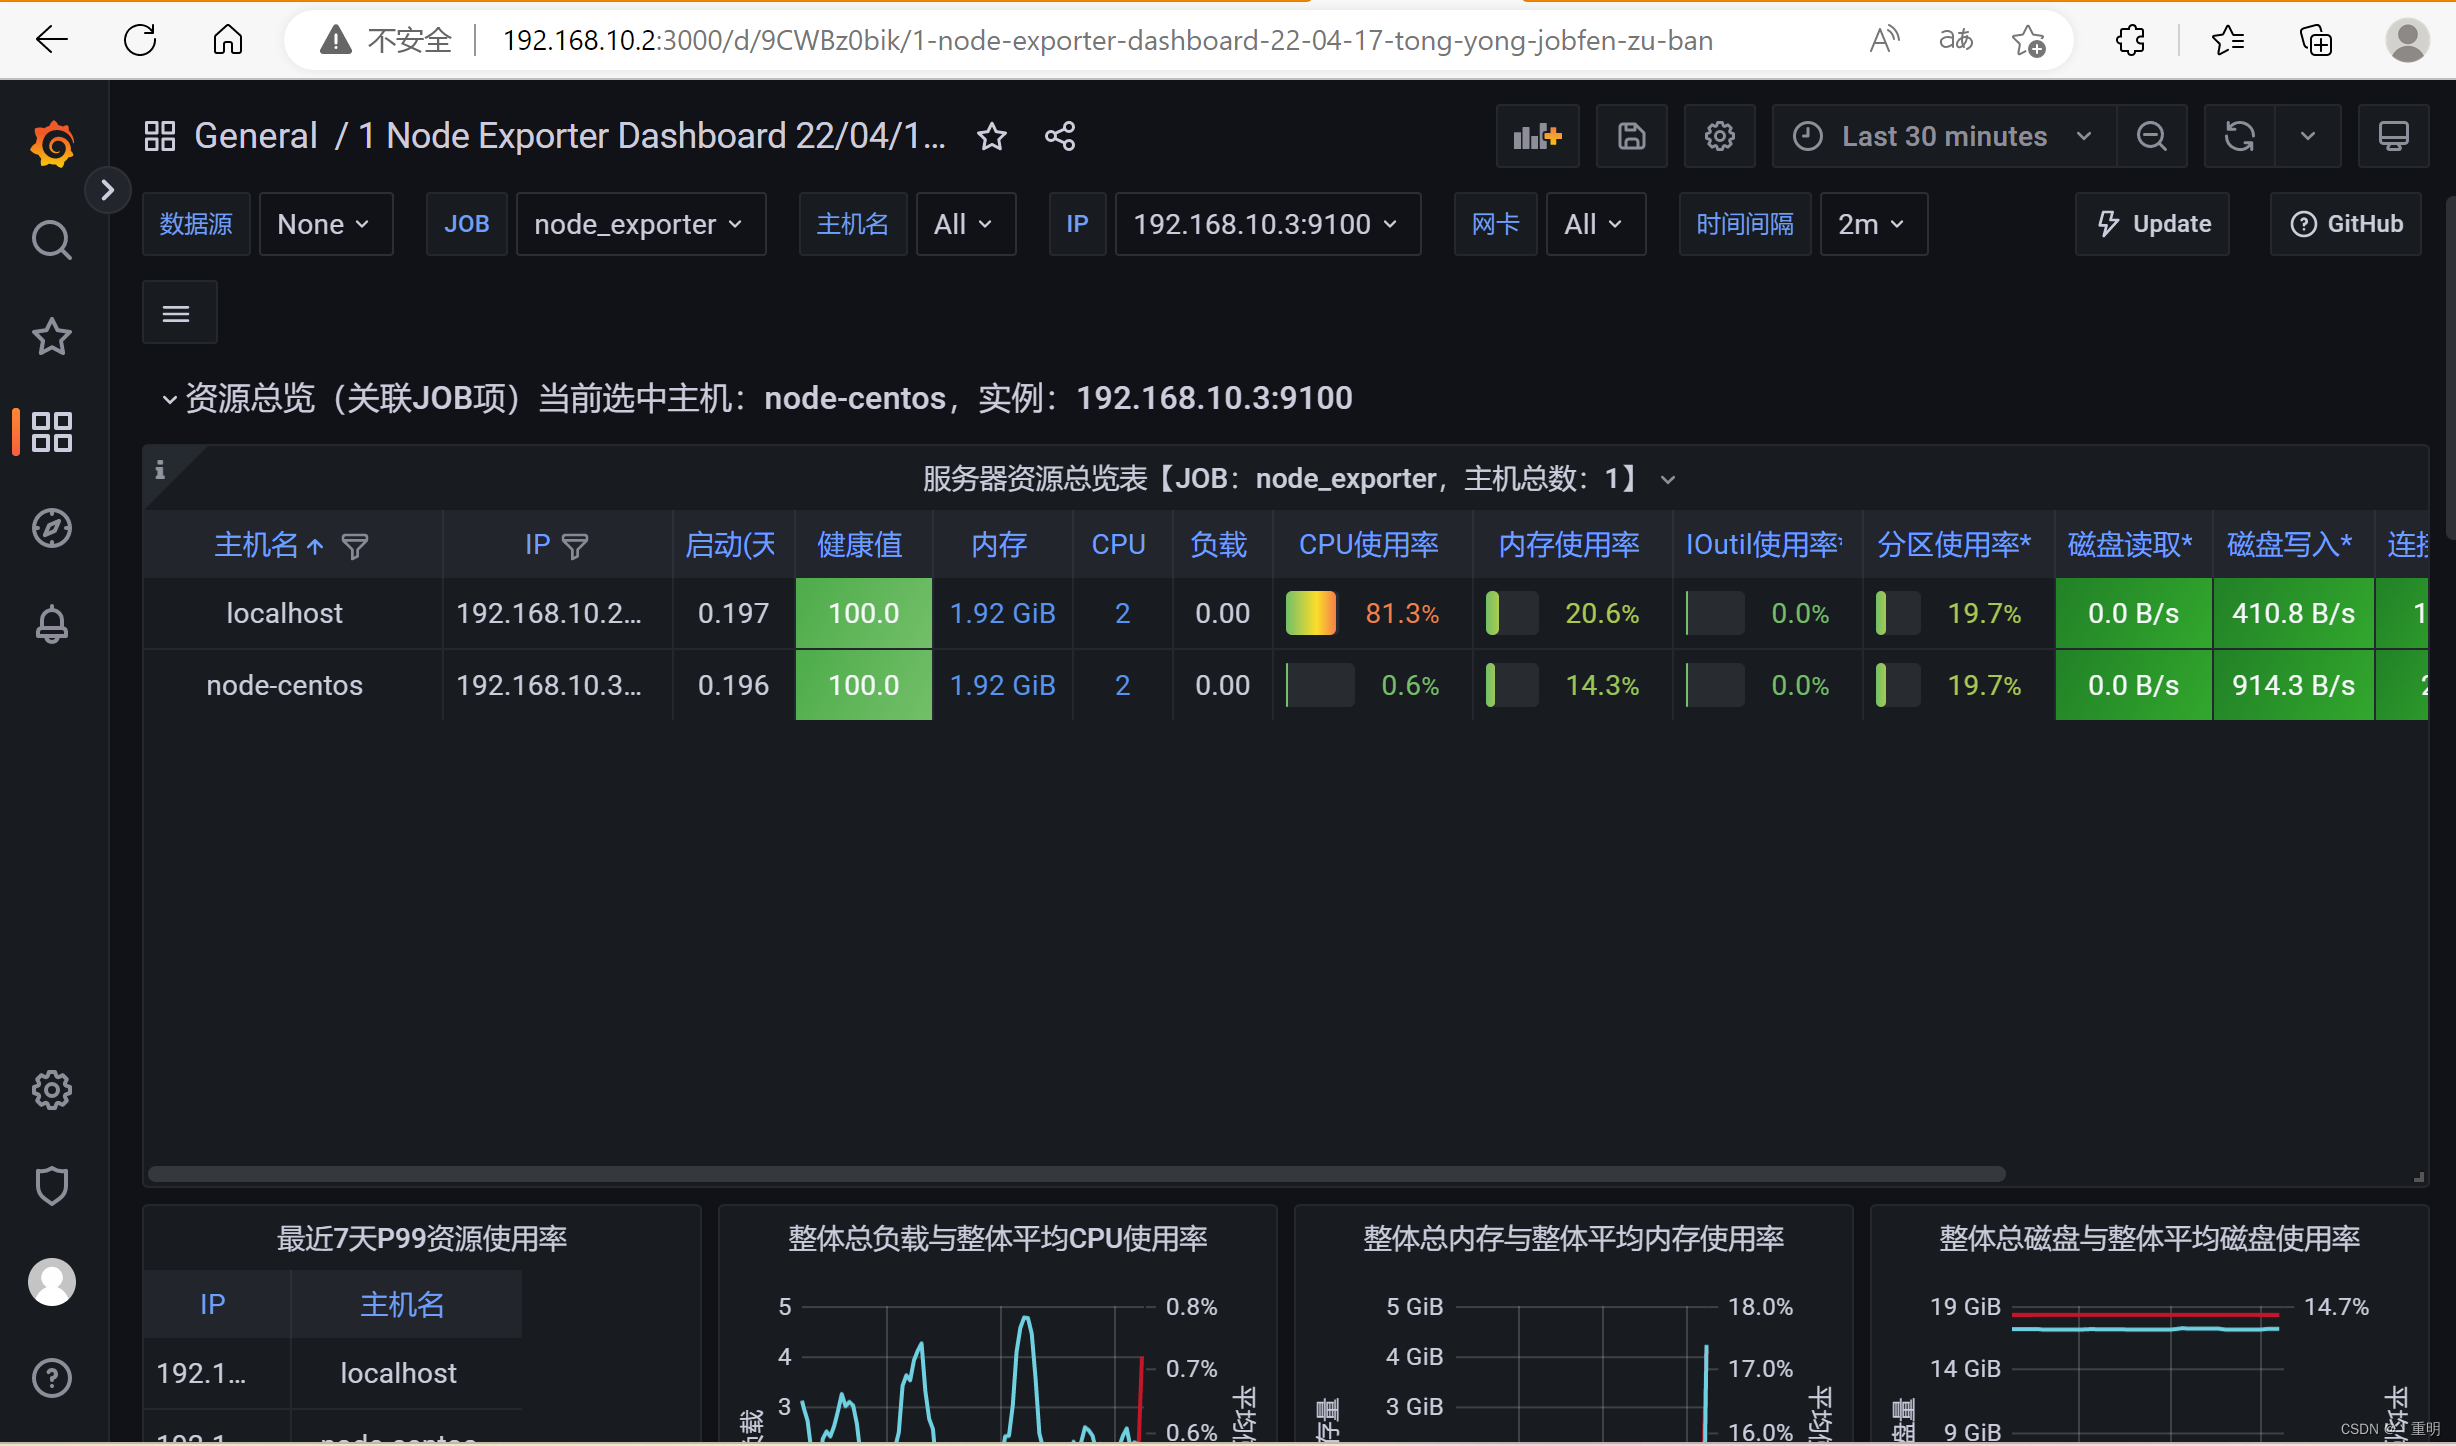
- 可以看到已经可以看到新添加的节点数据,此部分内容就先到这了。
相关内容
热门资讯
安卓子系统windows11,...
你知道吗?最近科技圈可是炸开了锅,因为安卓子系统在Windows 11上的兼容性成了大家热议的话题。...
电脑里怎么下载安卓系统,电脑端...
你有没有想过,你的电脑里也能装上安卓系统呢?没错,就是那个让你手机不离手的安卓!今天,就让我来带你一...
索尼相机魔改安卓系统,魔改系统...
你知道吗?最近在摄影圈里掀起了一股热潮,那就是索尼相机魔改安卓系统。这可不是一般的改装,而是让这些专...
安卓系统哪家的最流畅,安卓系统...
你有没有想过,为什么你的手机有时候像蜗牛一样慢吞吞的,而别人的手机却能像风一样快?这背后,其实就是安...
安卓最新系统4.42,深度解析...
你有没有发现,你的安卓手机最近是不是有点儿不一样了?没错,就是那个一直在默默更新的安卓最新系统4.4...
android和安卓什么系统最...
你有没有想过,你的安卓手机到底是用的是什么系统呢?是不是有时候觉得手机卡顿,运行缓慢,其实跟这个系统...
平板装安卓xp系统好,探索复古...
你有没有想过,把安卓系统装到平板上,再配上XP系统,这会是怎样一番景象呢?想象一边享受着安卓的便捷,...
投影仪装安卓系统,开启智能投影...
你有没有想过,家里的老式投影仪也能焕发第二春呢?没错,就是那个曾经陪你熬夜看电影的“老伙计”,现在它...
安卓系统无线车载carplay...
你有没有想过,开车的时候也能享受到苹果设备的便利呢?没错,就是那个让你在日常生活中离不开的iOS系统...
谷歌安卓8系统包,系统包解析与...
你有没有发现,手机更新换代的速度简直就像坐上了火箭呢?这不,最近谷歌又发布了安卓8系统包,听说这个新...
微软平板下软件安卓系统,开启全...
你有没有想过,在微软平板上也能畅享安卓系统的乐趣呢?没错,这就是今天我要跟你分享的神奇故事。想象你手...
coloros是基于安卓系统吗...
你有没有想过,手机里的那个色彩斑斓的界面,背后其实有着一个有趣的故事呢?没错,我要说的就是Color...
安卓神盾系统应用市场,一站式智...
你有没有发现,手机里的安卓神盾系统应用市场最近可是火得一塌糊涂啊!这不,我就来给你好好扒一扒,看看这...
黑莓平板安卓系统升级,解锁无限...
亲爱的读者们,你是否还记得那个曾经风靡一时的黑莓手机?那个标志性的全键盘,那个独特的黑莓体验,如今它...
安卓文件系统采用华为,探索高效...
你知道吗?最近安卓系统在文件管理上可是有了大动作呢!华为这个科技巨头,竟然悄悄地给安卓文件系统来了个...
深度系统能用安卓app,探索智...
你知道吗?现在科技的发展真是让人惊叹不已!今天,我要给你揭秘一个超级酷炫的话题——深度系统能用安卓a...
安卓系统的分区类型,深度解析存...
你有没有发现,你的安卓手机里藏着不少秘密?没错,就是那些神秘的分区类型。今天,就让我带你一探究竟,揭...
安卓系统铠无法兑换,揭秘无法兑...
最近是不是有很多小伙伴在玩安卓系统的游戏,突然发现了一个让人头疼的问题——铠无法兑换!别急,今天就来...
汽车安卓系统崩溃怎么刷,一键刷...
亲爱的车主朋友们,你是否曾遇到过汽车安卓系统崩溃的尴尬时刻?手机系统崩溃还能重启,但汽车系统崩溃了,...
miui系统可以刷安卓p系统吗...
亲爱的手机控们,你是否对MIUI系统情有独钟,同时又对安卓P系统的新鲜功能垂涎欲滴?今天,就让我带你...