
K8S 实用工具之四 - kubectl实用插件
开篇
📜 引言:
- 磨刀不误砍柴工
- 工欲善其事必先利其器
- 第一篇:《K8S 实用工具之一 - 如何合并多个 kubeconfig?》
- 第二篇:《K8S 实用工具之二 - 终端 UI K9S》
- 第三篇:《K8S 实用工具之三 - 图形化 UI Lens》
在《K8S 实用工具之一 - 如何合并多个 kubeconfig?》一文中,我们介绍了 kubectl 的插件管理工具 krew。接下来就顺势介绍几个实用的 kubectl 插件。
kubectl 实用插件
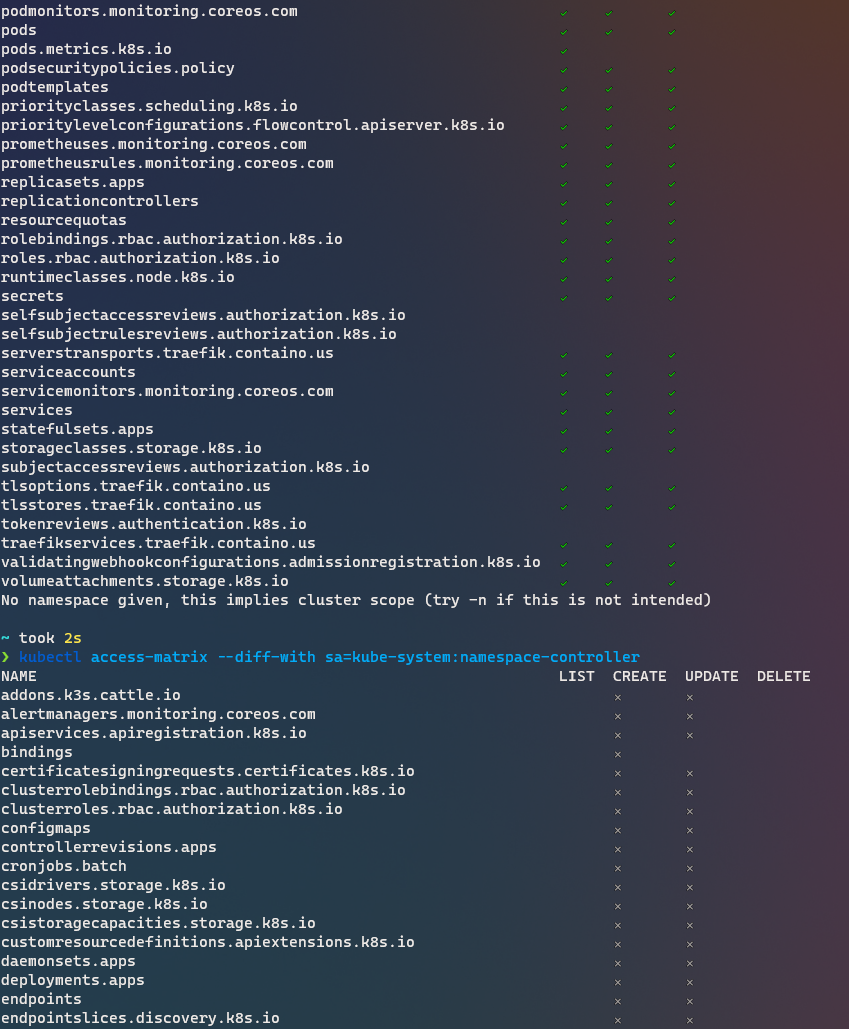
access-matrix
显示服务器资源的 RBAC 访问矩阵。
您是否曾经想过您对所提供的 kubernetes 集群拥有哪些访问权限?对于单个资源,您可以使用kubectl auth can-i 列表部署,但也许您正在寻找一个完整的概述?这就是它的作用。它列出当前用户和所有服务器资源的访问权限,类似于kubectl auth can-i --list。
安装
kubectl krew install access-matrix使用
Review access to cluster-scoped resources$ kubectl access-matrixReview access to namespaced resources in 'default'$ kubectl access-matrix --namespace defaultReview access as a different user$ kubectl access-matrix --as other-userReview access as a service-account$ kubectl access-matrix --sa kube-system:namespace-controllerReview access for different verbs$ kubectl access-matrix --verbs get,watch,patchReview access rights diff with another service account$ kubectl access-matrix --diff-with sa=kube-system:namespace-controller显示效果如下:
ca-cert
打印当前集群的 PEM CA 证书
安装
kubectl krew install ca-cert使用
kubectl ca-cert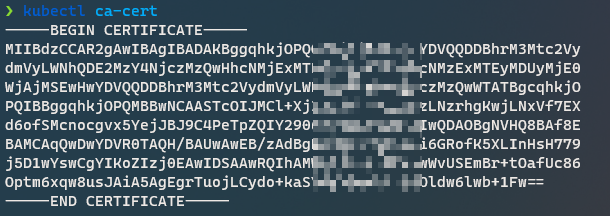
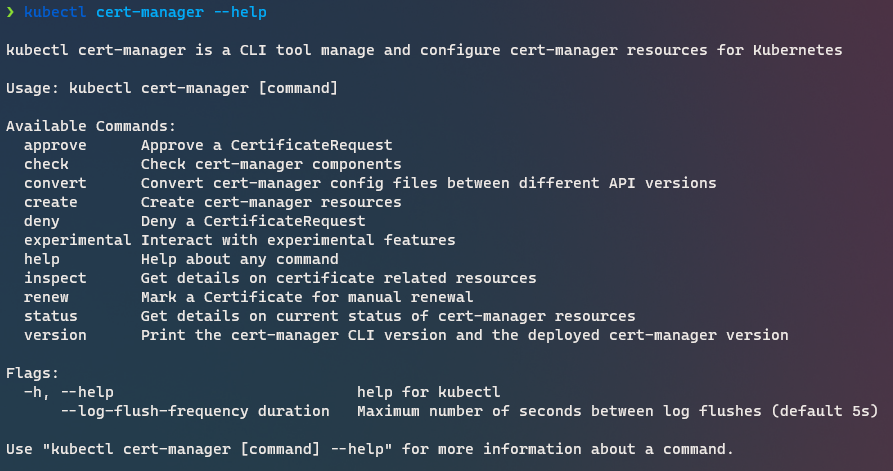
cert-manager
这个不用多介绍了吧?大名鼎鼎的 cert-manager,用来管理集群内的证书资源。

需要配合在 K8S 集群中安装 cert-manager 来使用。后面有时间再详细介绍
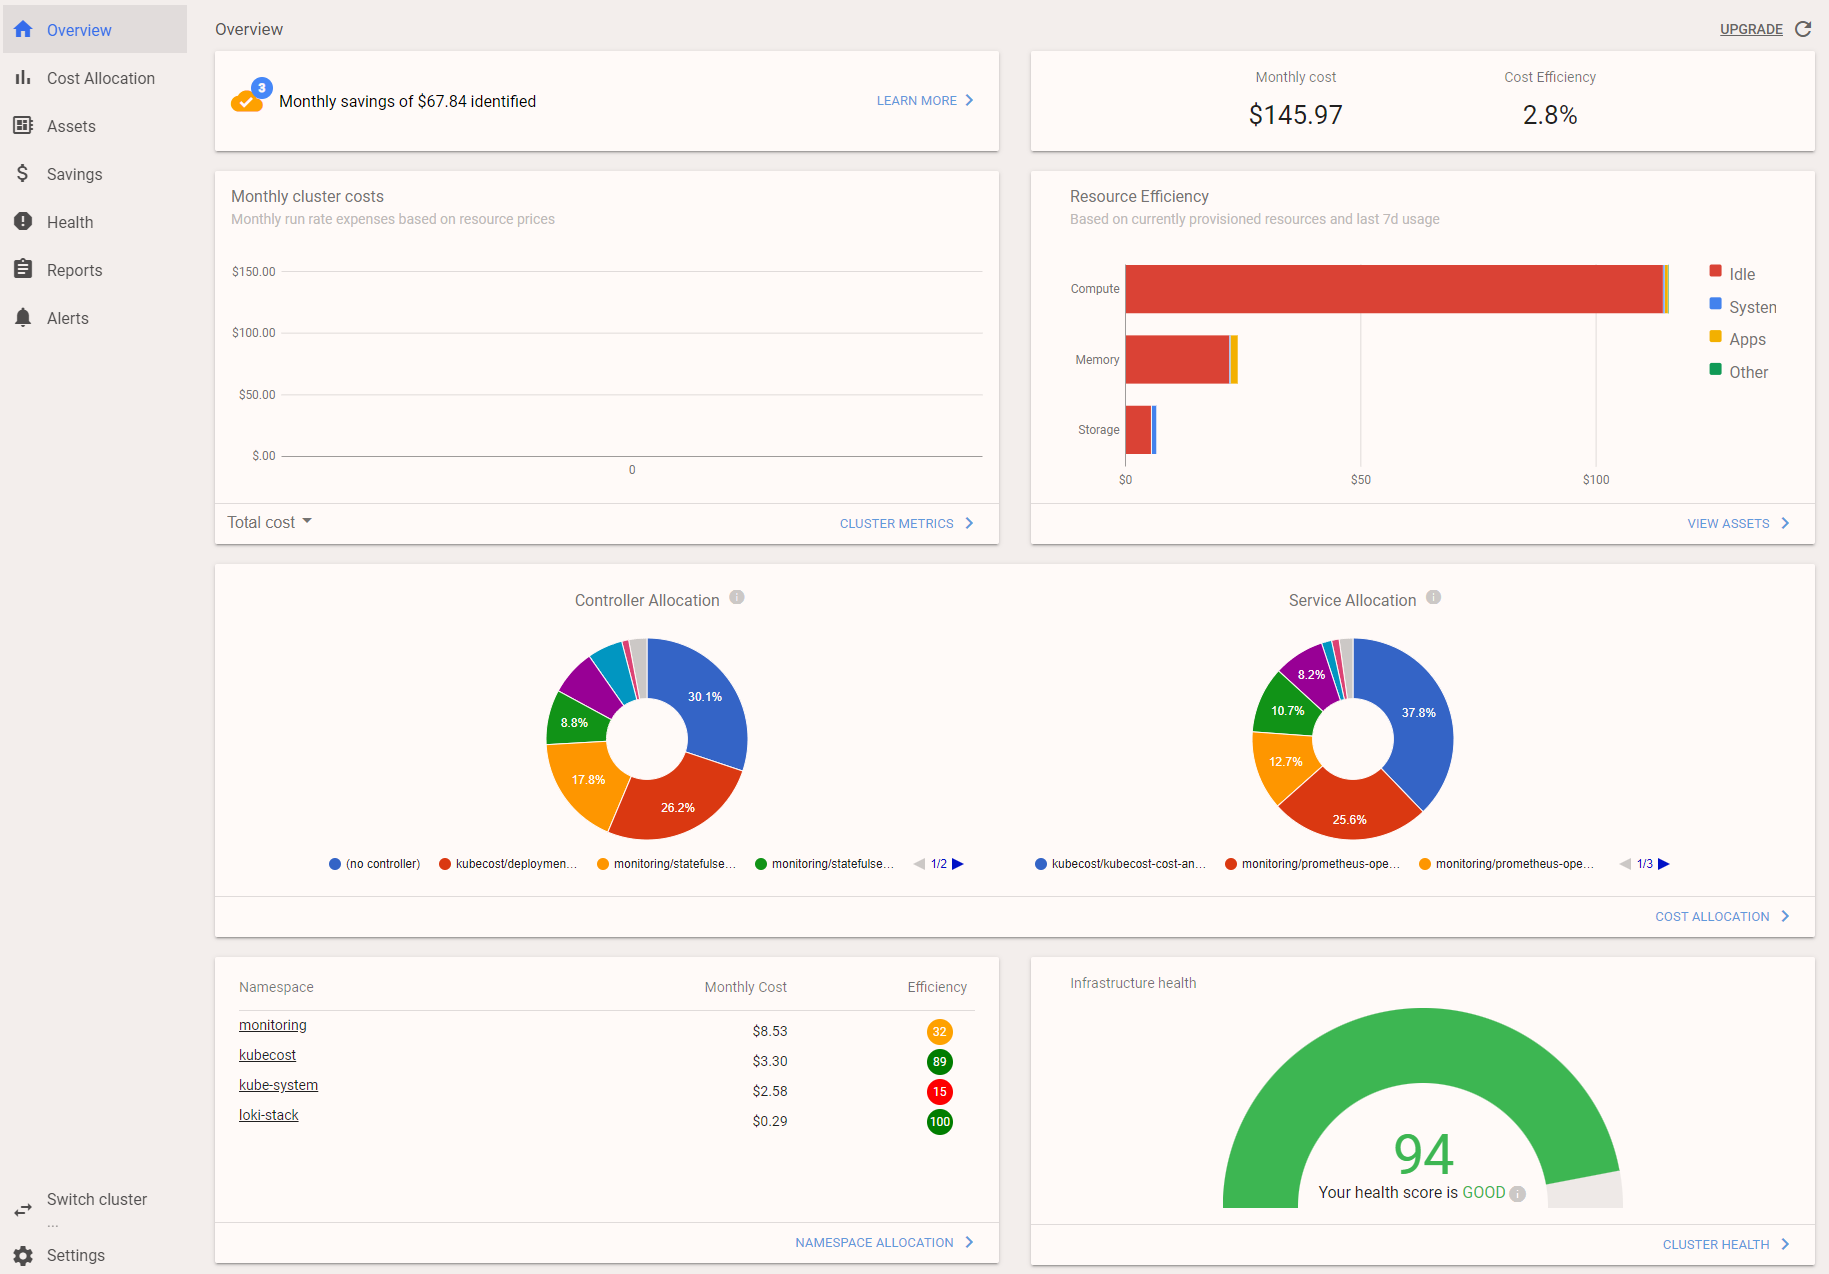
cost
查看集群成本信息。
kubectl-cost 是一个 kubectl 插件,通过 kubeccost api 提供简单的 CLI 访问 Kubernetes 成本分配指标。它允许开发人员、devops 和其他人快速确定 Kubernetes 工作负载的成本和效率。
安装
安装 Kubecost (Helm 的 options 可以看这里:cost-analyzer-helm-chart)
helm repo add kubecost https://kubecost.github.io/cost-analyzer/
helm upgrade -i --create-namespace kubecost kubecost/cost-analyzer --namespace kubecost --set kubecostToken="a3ViZWN0bEBrdWJlY29zdC5jb20=xm343yadf98"
部署完成显示如下:
NAME: kubecost
LAST DEPLOYED: Sat Nov 27 13:44:30 2021
NAMESPACE: kubecost
STATUS: deployed
REVISION: 1
TEST SUITE: None
NOTES:
--------------------------------------------------Kubecost has been successfully installed. When pods are Ready, you can enable port-forwarding with the following command:kubectl port-forward --namespace kubecost deployment/kubecost-cost-analyzer 9090Next, navigate to http://localhost:9090 in a web browser.Having installation issues? View our Troubleshooting Guide at http://docs.kubecost.com/troubleshoot-install
安装 kubectl cost
kubectl krew install cost
使用
使用可以直接通过浏览器来看:
ctx
在 kubeconfig 中切换上下文
安装
kubectl krew install ctx使用
使用也很简单,执行 kubectl ctx 然后选择要切换到哪个 context 即可。
$ kubectl ctx
Switched to context "multicloud-k3s".
deprecations
检查集群中已经弃用的对象。一般用在升级 K8S 之前做检查。又叫 KubePug

安装
kubectl krew install deprecations使用
使用也很简单,执行 kubectl deprecations 即可,然后如下面所示,它会告诉你哪些 API 已经弃用了,方便规划 K8S 升级规划。
$ kubectl deprecations
W1127 16:04:58.641429   28561 warnings.go:70] policy/v1beta1 PodSecurityPolicy is deprecated in v1.21+, unavailable in v1.25+
W1127 16:04:58.664058   28561 warnings.go:70] v1 ComponentStatus is deprecated in v1.19+
W1127 16:04:59.622247   28561 warnings.go:70] apiregistration.k8s.io/v1beta1 APIService is deprecated in v1.19+, unavailable in v1.22+; use apiregistration.k8s.io/v1 APIService
W1127 16:05:00.777598   28561 warnings.go:70] apiextensions.k8s.io/v1beta1 CustomResourceDefinition is deprecated in v1.16+, unavailable in v1.22+; use apiextensions.k8s.io/v1 CustomResourceDefinition
W1127 16:05:00.808486   28561 warnings.go:70] extensions/v1beta1 Ingress is deprecated in v1.14+, unavailable in v1.22+; use networking.k8s.io/v1 Ingress
RESULTS:
Deprecated APIs:PodSecurityPolicy found in policy/v1beta1├─ PodSecurityPolicy governs the ability to make requests that affect the Security Context that will be applied to a pod and container. Deprecated in 1.21.-> GLOBAL: kube-prometheus-stack-admission-> GLOBAL: loki-grafana-test-> GLOBAL: loki-promtail-> GLOBAL: loki-> GLOBAL: loki-grafana-> GLOBAL: prometheus-operator-grafana-test-> GLOBAL: prometheus-operator-alertmanager-> GLOBAL: prometheus-operator-grafana-> GLOBAL: prometheus-operator-prometheus-> GLOBAL: prometheus-operator-prometheus-node-exporter-> GLOBAL: prometheus-operator-kube-state-metrics-> GLOBAL: prometheus-operator-operator-> GLOBAL: kubecost-grafana-> GLOBAL: kubecost-cost-analyzer-pspComponentStatus found in /v1├─ ComponentStatus (and ComponentStatusList) holds the cluster validation info. Deprecated: This API is deprecated in v1.19+-> GLOBAL: controller-manager-> GLOBAL: schedulerDeleted APIs:
还可以和 CI 流程结合起来使用:
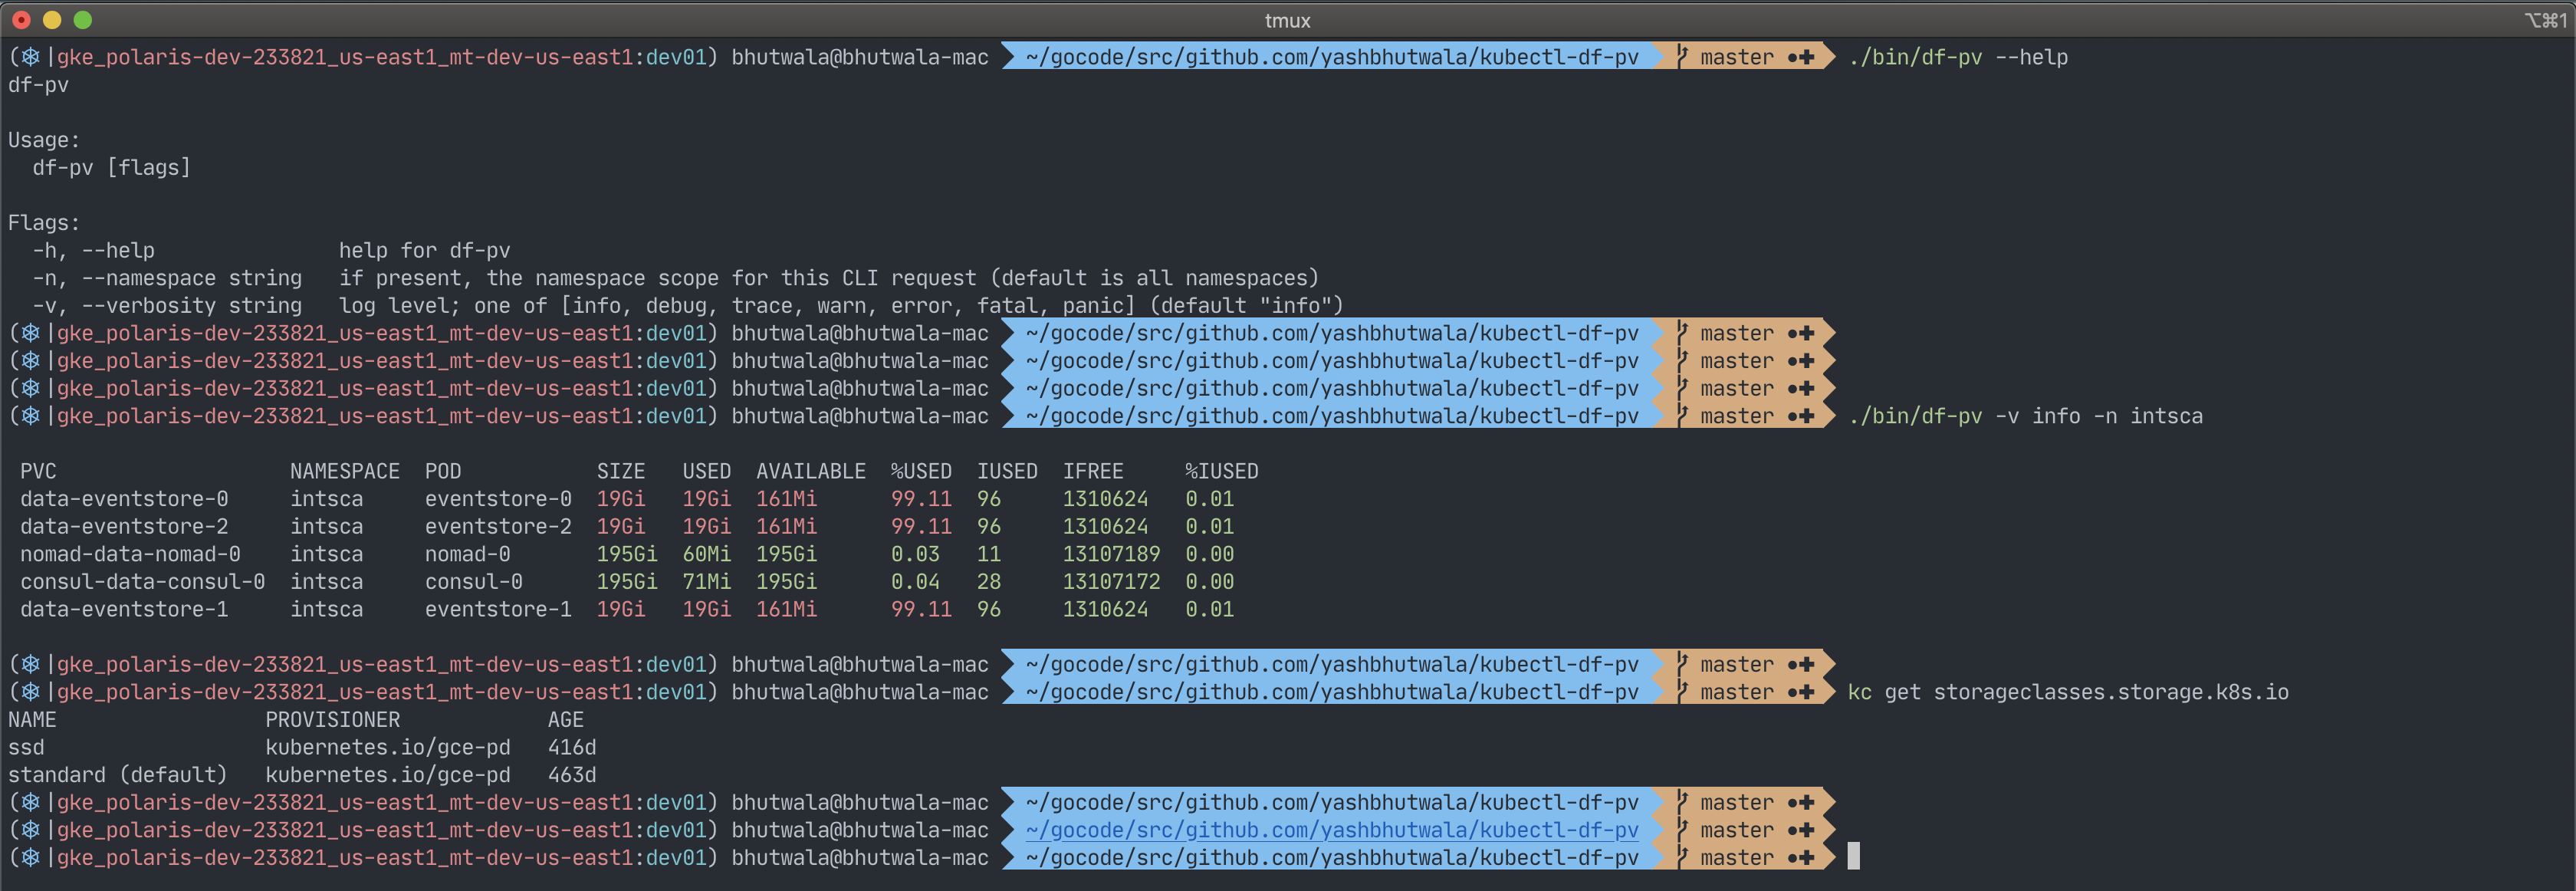
$ kubectl deprecations --input-file=./deployment/ --error-on-deleted --error-on-deprecateddf-pv
安装
kubectl krew install df-pv使用
执行 kubectl df-pv:
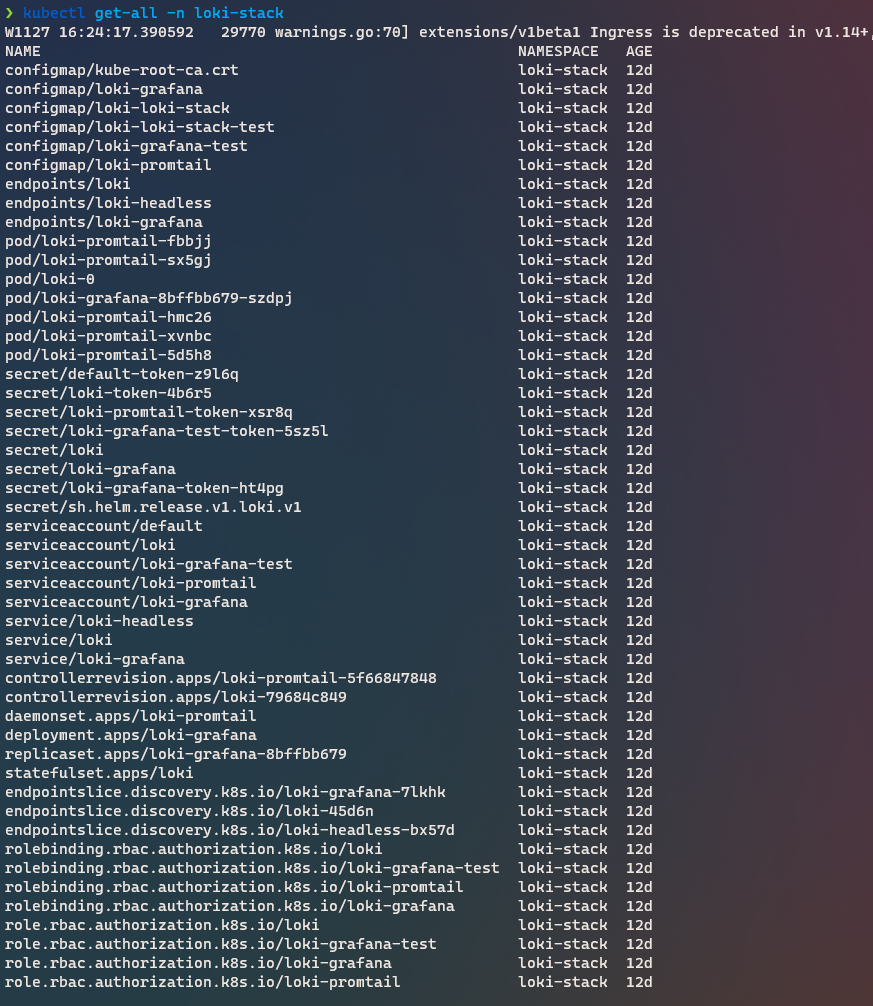
get-all
真正能 get 到 Kubernetes 的所有资源。
安装
kubectl krew install get-all使用
直接执行 kubectl get-all, 示例效果如下:
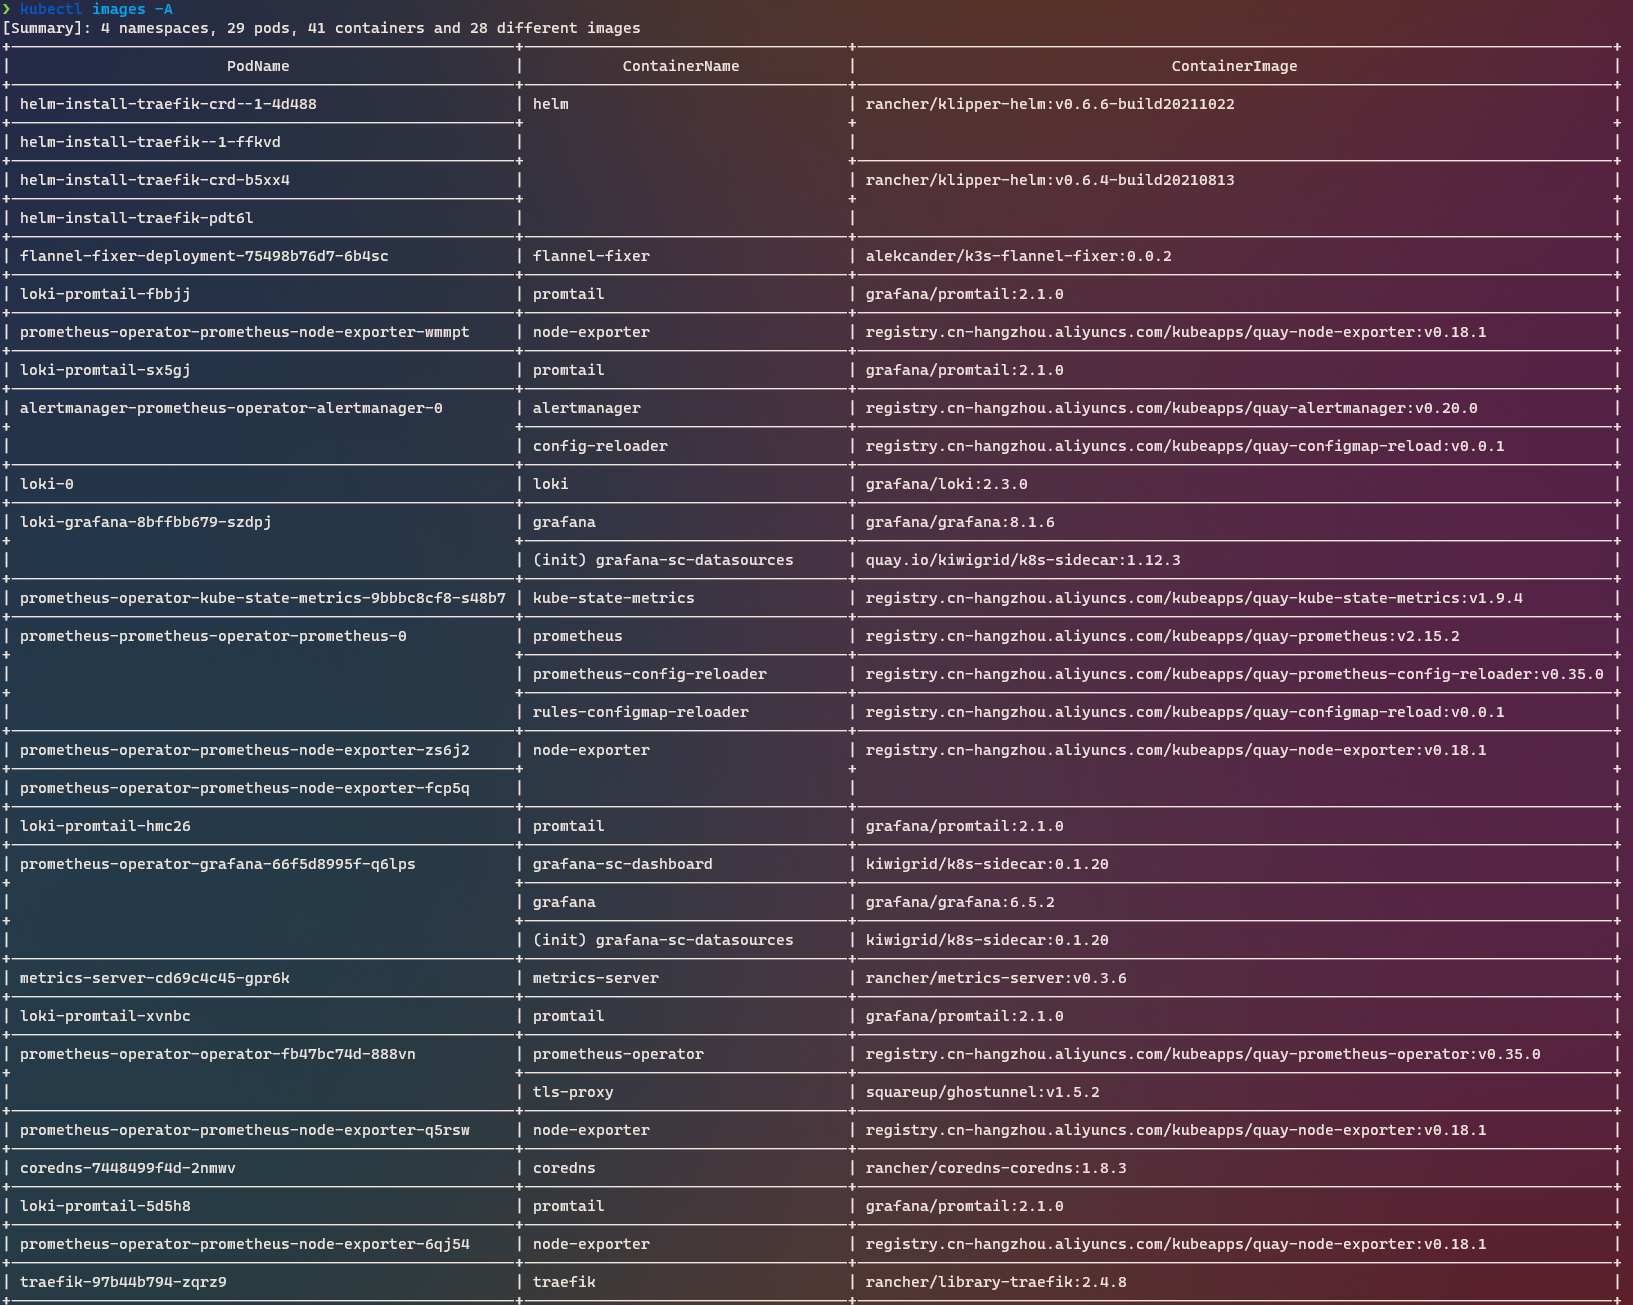
images
显示集群中使用的容器镜像。
安装
kubectl krew install images使用
执行 kubectl images -A ,结果如下:
kubesec-scan
使用 kubesec.io 扫描 Kubernetes 资源。
安装
kubectl krew install kubesec-scan使用
示例如下:
$ kubectl kubesec-scan statefulset loki -n loki-stack
scanning statefulset loki in namespace loki-stack
kubesec.io score: 4
-----------------
Advise1. .spec .volumeClaimTemplates[] .spec .accessModes | index("ReadWriteOnce")
2. containers[] .securityContext .runAsNonRoot == true
Force the running image to run as a non-root user to ensure least privilege
3. containers[] .securityContext .capabilities .drop
Reducing kernel capabilities available to a container limits its attack surface
4. containers[] .securityContext .runAsUser > 10000
Run as a high-UID user to avoid conflicts with the host's user table
5. containers[] .securityContext .capabilities .drop | index("ALL")
Drop all capabilities and add only those required to reduce syscall attack surface
neat
从Kubernetes显示中删除杂乱以使其更具可读性。
安装
kubectl krew install neat使用
示例如下:
我们不关注的一些信息如:creationTimeStamp 、 managedFields 等被移除了。很清爽
$ kubectl neat get -- pod loki-0 -oyaml -n loki-stack
apiVersion: v1
kind: Pod
metadata:annotations:checksum/config: b9ab988df734dccd44833416670e70085a2a31cfc108e68605f22d3a758f50b5prometheus.io/port: http-metricsprometheus.io/scrape: "true"labels:app: lokicontroller-revision-hash: loki-79684c849name: lokirelease: lokistatefulset.kubernetes.io/pod-name: loki-0name: loki-0namespace: loki-stack
spec:containers:- args:- -config.file=/etc/loki/loki.yamlimage: grafana/loki:2.3.0livenessProbe:httpGet:path: /readyport: http-metricsinitialDelaySeconds: 45name: lokiports:- containerPort: 3100name: http-metricsreadinessProbe:httpGet:path: /readyport: http-metricsinitialDelaySeconds: 45securityContext:readOnlyRootFilesystem: truevolumeMounts:- mountPath: /etc/lokiname: config- mountPath: /dataname: storage- mountPath: /var/run/secrets/kubernetes.io/serviceaccountname: kube-api-access-jhsvmreadOnly: truehostname: loki-0preemptionPolicy: PreemptLowerPrioritypriority: 0securityContext:fsGroup: 10001runAsGroup: 10001runAsNonRoot: truerunAsUser: 10001serviceAccountName: lokisubdomain: loki-headlessterminationGracePeriodSeconds: 4800tolerations:- effect: NoExecutekey: node.kubernetes.io/not-readyoperator: ExiststolerationSeconds: 300- effect: NoExecutekey: node.kubernetes.io/unreachableoperator: ExiststolerationSeconds: 300volumes:- name: configsecret:secretName: loki- name: storage- name: kube-api-access-jhsvmprojected:sources:- serviceAccountToken:expirationSeconds: 3607path: token- configMap:items:- key: ca.crtpath: ca.crtname: kube-root-ca.crt- downwardAPI:items:- fieldRef:fieldPath: metadata.namespacepath: namespace
node-shell
通过 kubectl 在一个 node 上生成一个 root shell
安装
kubectl krew install node-shell使用
示例如下:
$ kubectl node-shell instance-ykx0ofns
spawning "nsenter-fr393w" on "instance-ykx0ofns"
If you don't see a command prompt, try pressing enter.
root@instance-ykx0ofns:/# hostname
instance-ykx0ofns
root@instance-ykx0ofns:/# ifconfig
...
eth0: flags=4163  mtu 1500inet 192.168.64.4  netmask 255.255.240.0  broadcast 192.168.79.255inet6 fe80::f820:20ff:fe16:3084  prefixlen 64  scopeid 0x20ether fa:20:20:16:30:84  txqueuelen 1000  (Ethernet)RX packets 24386113  bytes 26390915146 (26.3 GB)RX errors 0  dropped 0  overruns 0  frame 0TX packets 18840452  bytes 3264860766 (3.2 GB)TX errors 0  dropped 0 overruns 0  carrier 0  collisions 0
...
root@instance-ykx0ofns:/# exit
logout
pod default/nsenter-fr393w terminated (Error)
pod "nsenter-fr393w" deleted
ns
切换 Kubernetes 的 ns。
安装
kubectl krew install ns使用
$ kubectl ns loki-stack
Context "multicloud-k3s" modified.
Active namespace is "loki-stack".$ kubectl get pod
NAME                           READY   STATUS    RESTARTS   AGE
loki-promtail-fbbjj            1/1     Running   0          12d
loki-promtail-sx5gj            1/1     Running   0          12d
loki-0                         1/1     Running   0          12d
loki-grafana-8bffbb679-szdpj   1/1     Running   0          12d
loki-promtail-hmc26            1/1     Running   0          12d
loki-promtail-xvnbc            1/1     Running   0          12d
loki-promtail-5d5h8            1/1     Running   0          12d
outdated
查找集群中运行的过时容器镜像。
安装
kubectl krew install outdated使用
$ kubectl outdated
Image                                                  Current             Latest             Behind
index.docker.io/rancher/klipper-helm                   v0.6.6-build202110220.6.8-build202111232
docker.io/rancher/klipper-helm                         v0.6.4-build202108130.6.8-build202111234
docker.io/alekcander/k3s-flannel-fixer                 0.0.2               0.0.2              0
docker.io/rancher/metrics-server                       v0.3.6              0.4.1              1
docker.io/rancher/coredns-coredns                      1.8.3               1.8.3              0
docker.io/rancher/library-traefik                      2.4.8               2.4.9              1
docker.io/rancher/local-path-provisioner               v0.0.19             0.0.20             1
docker.io/grafana/promtail                             2.1.0               2.4.1              5
docker.io/grafana/loki                                 2.3.0               2.4.1              2
quay.io/kiwigrid/k8s-sidecar                           1.12.3              1.14.2             5
docker.io/grafana/grafana                              8.1.6               8.3.0-beta1        8
registry.cn-hangzhou.aliyuncs.com/kubeapps/quay...     v0.18.1             1.3.0              9
registry.cn-hangzhou.aliyuncs.com/kubeapps/quay...     v0.20.0             0.23.0             5
registry.cn-hangzhou.aliyuncs.com/kubeapps/quay...     v0.0.1              0.0.1              0
registry.cn-hangzhou.aliyuncs.com/kubeapps/quay...     v1.9.4              2.0.0-beta         5
registry.cn-hangzhou.aliyuncs.com/kubeapps/quay...     v2.15.2             2.31.1             38
registry.cn-hangzhou.aliyuncs.com/kubeapps/quay...     v0.35.0             0.42.1             11
docker.io/kiwigrid/k8s-sidecar                         0.1.20              1.14.2             46
docker.io/grafana/grafana                              6.5.2               8.3.0-beta1        75
registry.cn-hangzhou.aliyuncs.com/kubeapps/quay...     v0.35.0             0.42.1             12
docker.io/squareup/ghostunnel                          v1.5.2              1.5.2              0
docker.io/grafana/grafana                              8.1.2               8.3.0-beta1        12
docker.io/kiwigrid/k8s-sidecar                         1.12.3              1.14.2             5
docker.io/prom/prometheus                              v2.22.2             2.31.1             21
popeye(大力水手)
扫描集群以发现潜在的资源问题。就是 K9S 也在使用的 popeye。
Popeye 是一个实用程序,它扫描实时的Kubernetes集群,并报告部署的资源和配置的潜在问题。它根据已部署的内容而不是磁盘上的内容来清理集群。通过扫描集群,它可以检测到错误配置,并帮助您确保最佳实践已经到位,从而避免未来的麻烦。它旨在减少人们在野外操作Kubernetes集群时所面临的认知过载。此外,如果您的集群使用度量服务器,它会报告分配的资源超过或低于分配的资源,并试图在集群耗尽容量时警告您。
Popeye 是一个只读的工具,它不会改变任何你的Kubernetes资源在任何方式!
安装
kubectl krew install popeye使用
如下:
❯ kubectl popeye___     ___ _____   _____                                                      K          .-'-.
| _ \___| _ \ __\ \ / / __|                                                      8     __|      `\
|  _/ _ \  _/ _| \ V /| _|                                                        s   `-,-`--._   `\
|_| \___/_| |___| |_| |___|                                                      []  .->'  a     `|-'Biffs`em and Buffs`em!                                                          `=/ (__/_       /\_,    `    _)`----;  |DAEMONSETS (1 SCANNED)                                                         💥 0 😱 1 🔊 0 ✅ 0 0٪
┅┅┅┅┅┅┅┅┅┅┅┅┅┅┅┅┅┅┅┅┅┅┅┅┅┅┅┅┅┅┅┅┅┅┅┅┅┅┅┅┅┅┅┅┅┅┅┅┅┅┅┅┅┅┅┅┅┅┅┅┅┅┅┅┅┅┅┅┅┅┅┅┅┅┅┅┅┅┅┅┅┅┅┅┅┅┅┅┅┅┅┅┅┅┅┅┅┅┅┅· loki-stack/loki-promtail.......................................................................😱🔊 [POP-404] Deprecation check failed. Unable to assert resource version.🐳 promtail😱 [POP-106] No resources requests/limits defined.DEPLOYMENTS (1 SCANNED)                                                        💥 0 😱 1 🔊 0 ✅ 0 0٪
┅┅┅┅┅┅┅┅┅┅┅┅┅┅┅┅┅┅┅┅┅┅┅┅┅┅┅┅┅┅┅┅┅┅┅┅┅┅┅┅┅┅┅┅┅┅┅┅┅┅┅┅┅┅┅┅┅┅┅┅┅┅┅┅┅┅┅┅┅┅┅┅┅┅┅┅┅┅┅┅┅┅┅┅┅┅┅┅┅┅┅┅┅┅┅┅┅┅┅┅· loki-stack/loki-grafana........................................................................😱🔊 [POP-404] Deprecation check failed. Unable to assert resource version.🐳 grafana😱 [POP-106] No resources requests/limits defined.🐳 grafana-sc-datasources😱 [POP-106] No resources requests/limits defined.PODS (7 SCANNED)                                                               💥 0 😱 7 🔊 0 ✅ 0 0٪
┅┅┅┅┅┅┅┅┅┅┅┅┅┅┅┅┅┅┅┅┅┅┅┅┅┅┅┅┅┅┅┅┅┅┅┅┅┅┅┅┅┅┅┅┅┅┅┅┅┅┅┅┅┅┅┅┅┅┅┅┅┅┅┅┅┅┅┅┅┅┅┅┅┅┅┅┅┅┅┅┅┅┅┅┅┅┅┅┅┅┅┅┅┅┅┅┅┅┅┅· loki-stack/loki-0..............................................................................😱🔊 [POP-206] No PodDisruptionBudget defined.😱 [POP-301] Connects to API Server? ServiceAccount token is mounted.🐳 loki😱 [POP-106] No resources requests/limits defined.· loki-stack/loki-grafana-8bffbb679-szdpj........................................................😱🔊 [POP-206] No PodDisruptionBudget defined.😱 [POP-301] Connects to API Server? ServiceAccount token is mounted.🐳 grafana😱 [POP-106] No resources requests/limits defined.🔊 [POP-105] Liveness probe uses a port#, prefer a named port.🔊 [POP-105] Readiness probe uses a port#, prefer a named port.🐳 grafana-sc-datasources😱 [POP-106] No resources requests/limits defined.· loki-stack/loki-promtail-5d5h8.................................................................😱🔊 [POP-206] No PodDisruptionBudget defined.😱 [POP-301] Connects to API Server? ServiceAccount token is mounted.😱 [POP-302] Pod could be running as root user. Check SecurityContext/image.🐳 promtail😱 [POP-106] No resources requests/limits defined.😱 [POP-103] No liveness probe.😱 [POP-306] Container could be running as root user. Check SecurityContext/Image.SUMMARY
┅┅┅┅┅┅┅┅┅┅┅┅┅┅┅┅┅┅┅┅┅┅┅┅┅┅┅┅┅┅┅┅┅┅┅┅┅┅┅┅┅┅┅┅┅┅┅┅┅┅┅┅┅┅┅┅┅┅┅┅┅┅┅┅┅┅┅┅┅┅┅┅┅┅┅┅┅┅┅┅┅┅┅┅┅┅┅┅┅┅┅┅┅┅┅┅┅┅┅┅
Your cluster score: 80 -- Bo          .-'-.o     __| B    `\o   `-,-`--._   `\[]  .->'  a     `|-'`=/ (__/_       /\_,    `    _)`----;  |
resource-capacity
提供资源请求、限制和使用率的概览。
这是一个简单的 CLI,它提供 Kubernetes 集群中资源请求、限制和利用率的概览。它试图将来自 kubectl top 和 kubectl describe 的输出的最好部分组合成一个简单易用的 CLI,专注于集群资源。
安装
kubectl krew install resource-capacity使用
下面示例是看 node 的,也可以看 pod,通过 label 筛选, 并排序等功能。
$ kubectl resource-capacity
NODE                       CPU REQUESTS   CPU LIMITS   MEMORY REQUESTS   MEMORY LIMITS
*                          710m (14%)     300m (6%)    535Mi (6%)        257Mi (3%)
09b2brd7robnn5zi-1106883   0Mi (0%)       0Mi (0%)     0Mi (0%)          0Mi (0%)
hecs-348550                100m (10%)     100m (10%)   236Mi (11%)       27Mi (1%)
instance-wy7ksibk          310m (31%)     0Mi (0%)     174Mi (16%)       0Mi (0%)
instance-ykx0ofns          200m (20%)     200m (20%)   53Mi (5%)         53Mi (5%)
izuf656om146vu1n6pd6lpz    100m (10%)     0Mi (0%)     74Mi (3%)         179Mi (8%)
score
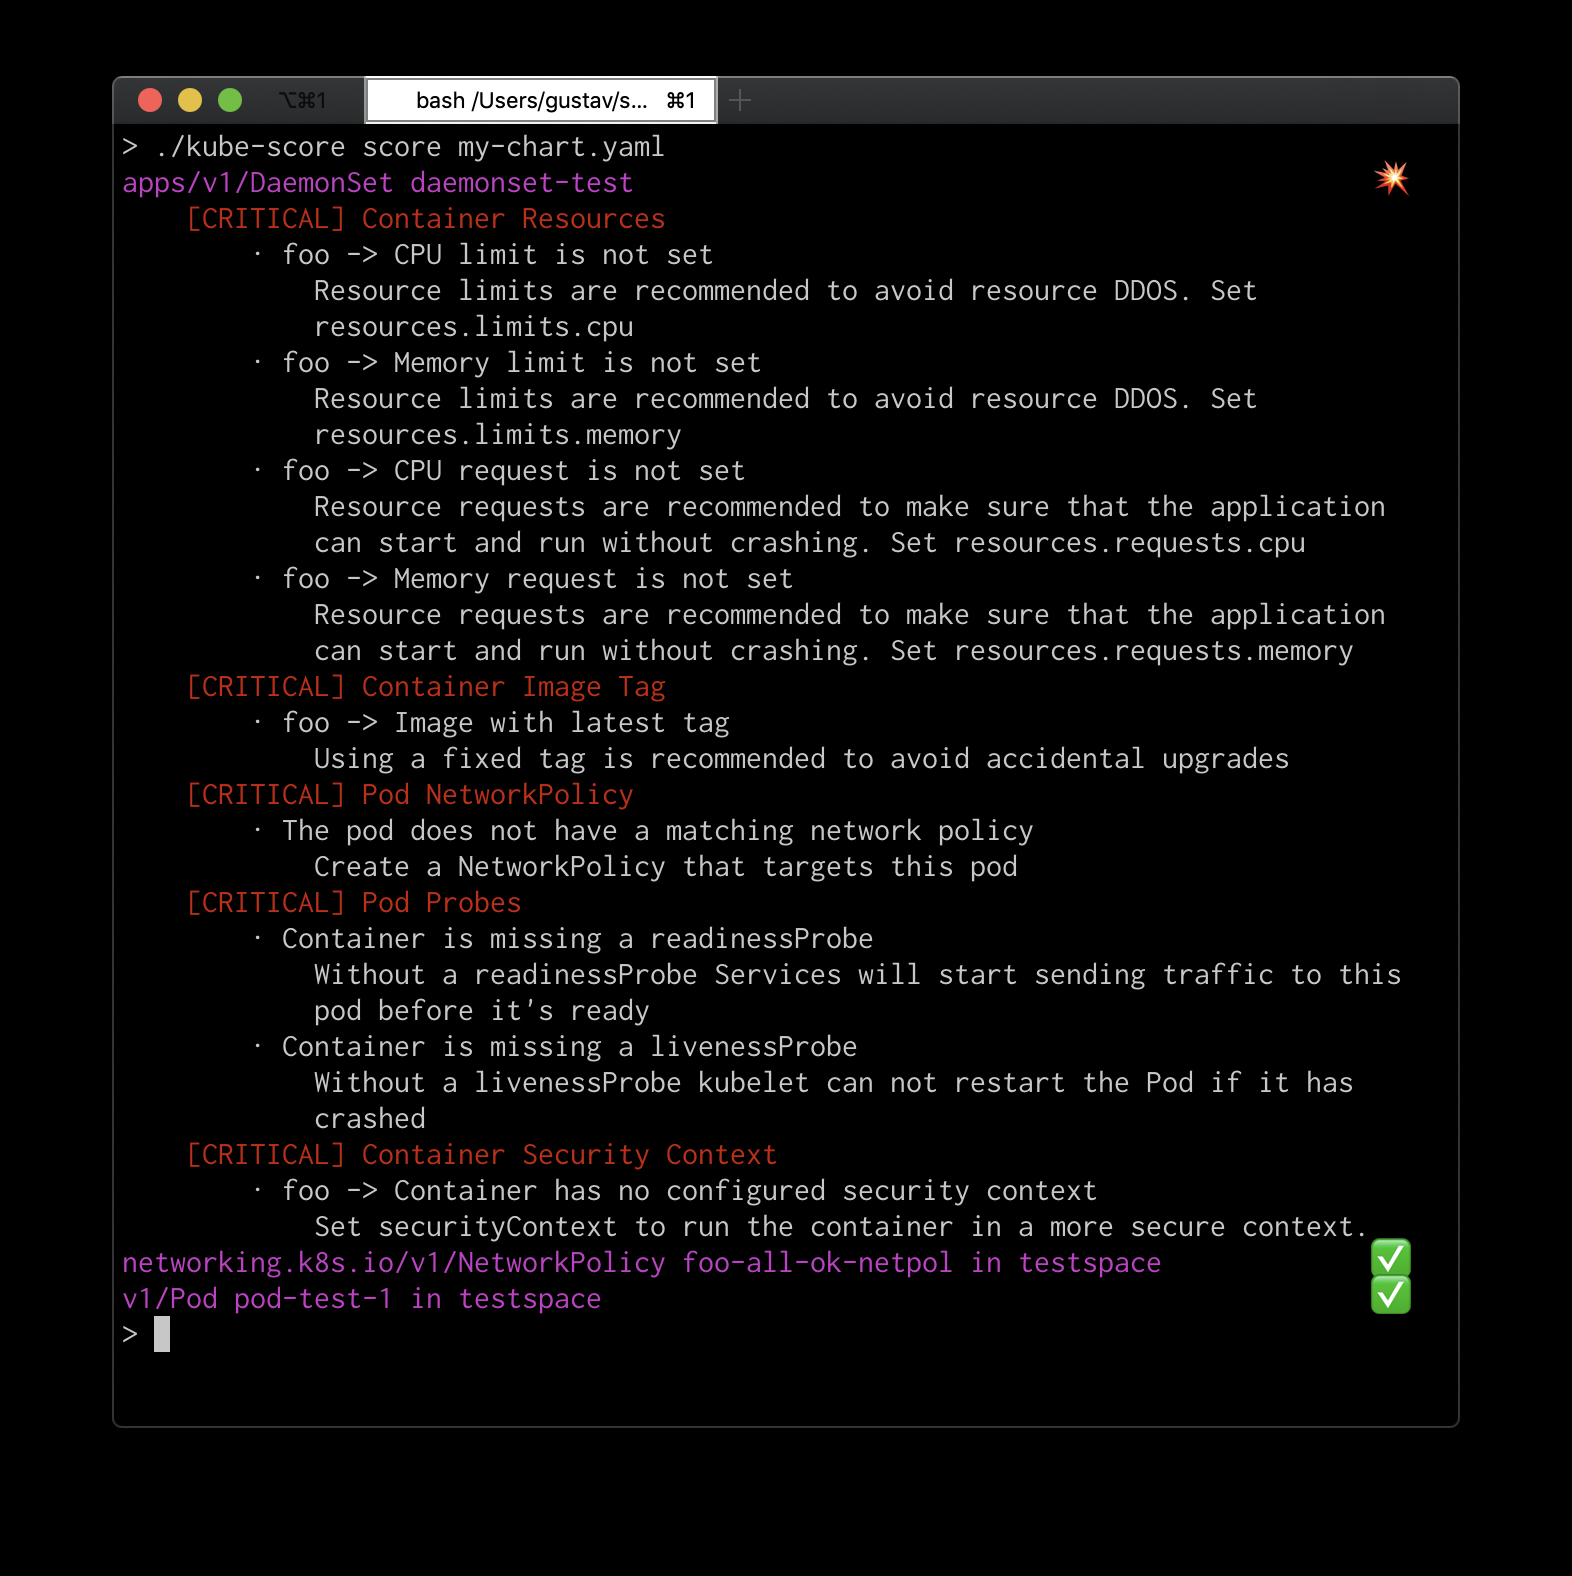
Kubernetes 静态代码分析。
安装
kubectl krew install score使用
也是可以和 CI 进行集成的。示例如下:
sniff
强烈推荐,之前有次 POD 网络出现问题就是通过这个帮助来进行分析的。它会使用 tcpdump 和 wireshark 在 pod 上启动远程抓包
安装
kubectl krew install sniff使用
kubectl < 1.12:
kubectl plugin sniff  [-n ] [-c ] [-i ] [-f ] [-o OUTPUT_FILE] [-l LOCAL_TCPDUMP_FILE] [-r REMOTE_TCPDUMP_FILE]kubectl >= 1.12:
kubectl sniff  [-n ] [-c ] [-i ] [-f ] [-o OUTPUT_FILE] [-l LOCAL_TCPDUMP_FILE] [-r REMOTE_TCPDUMP_FILE]
如下:
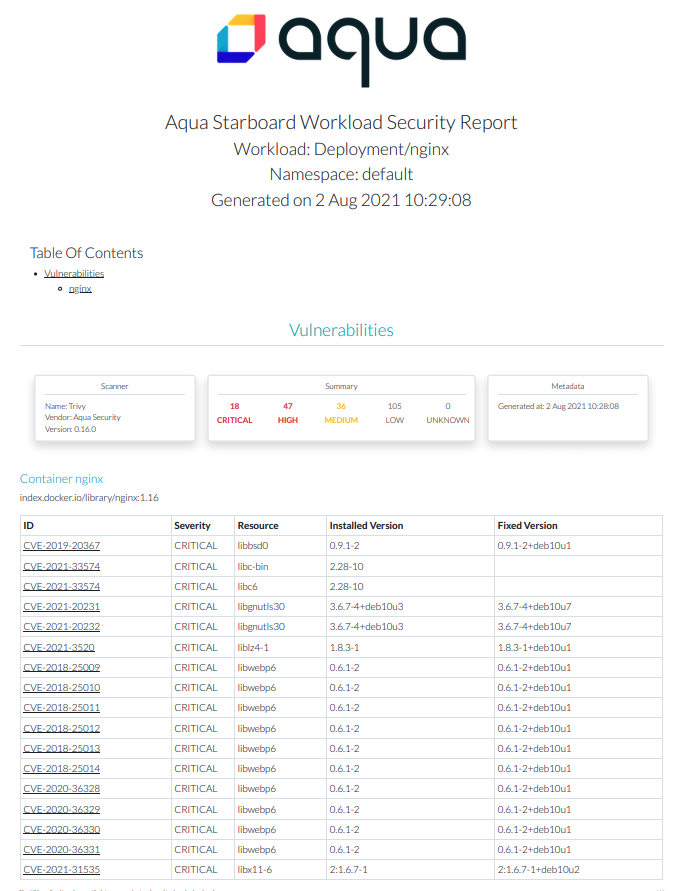
starboard
也是一个安全扫描工具。
安装
kubectl krew install starboard使用
kubectl starboard report deployment/nginx > nginx.deploy.html就可以生成一份安全报告:
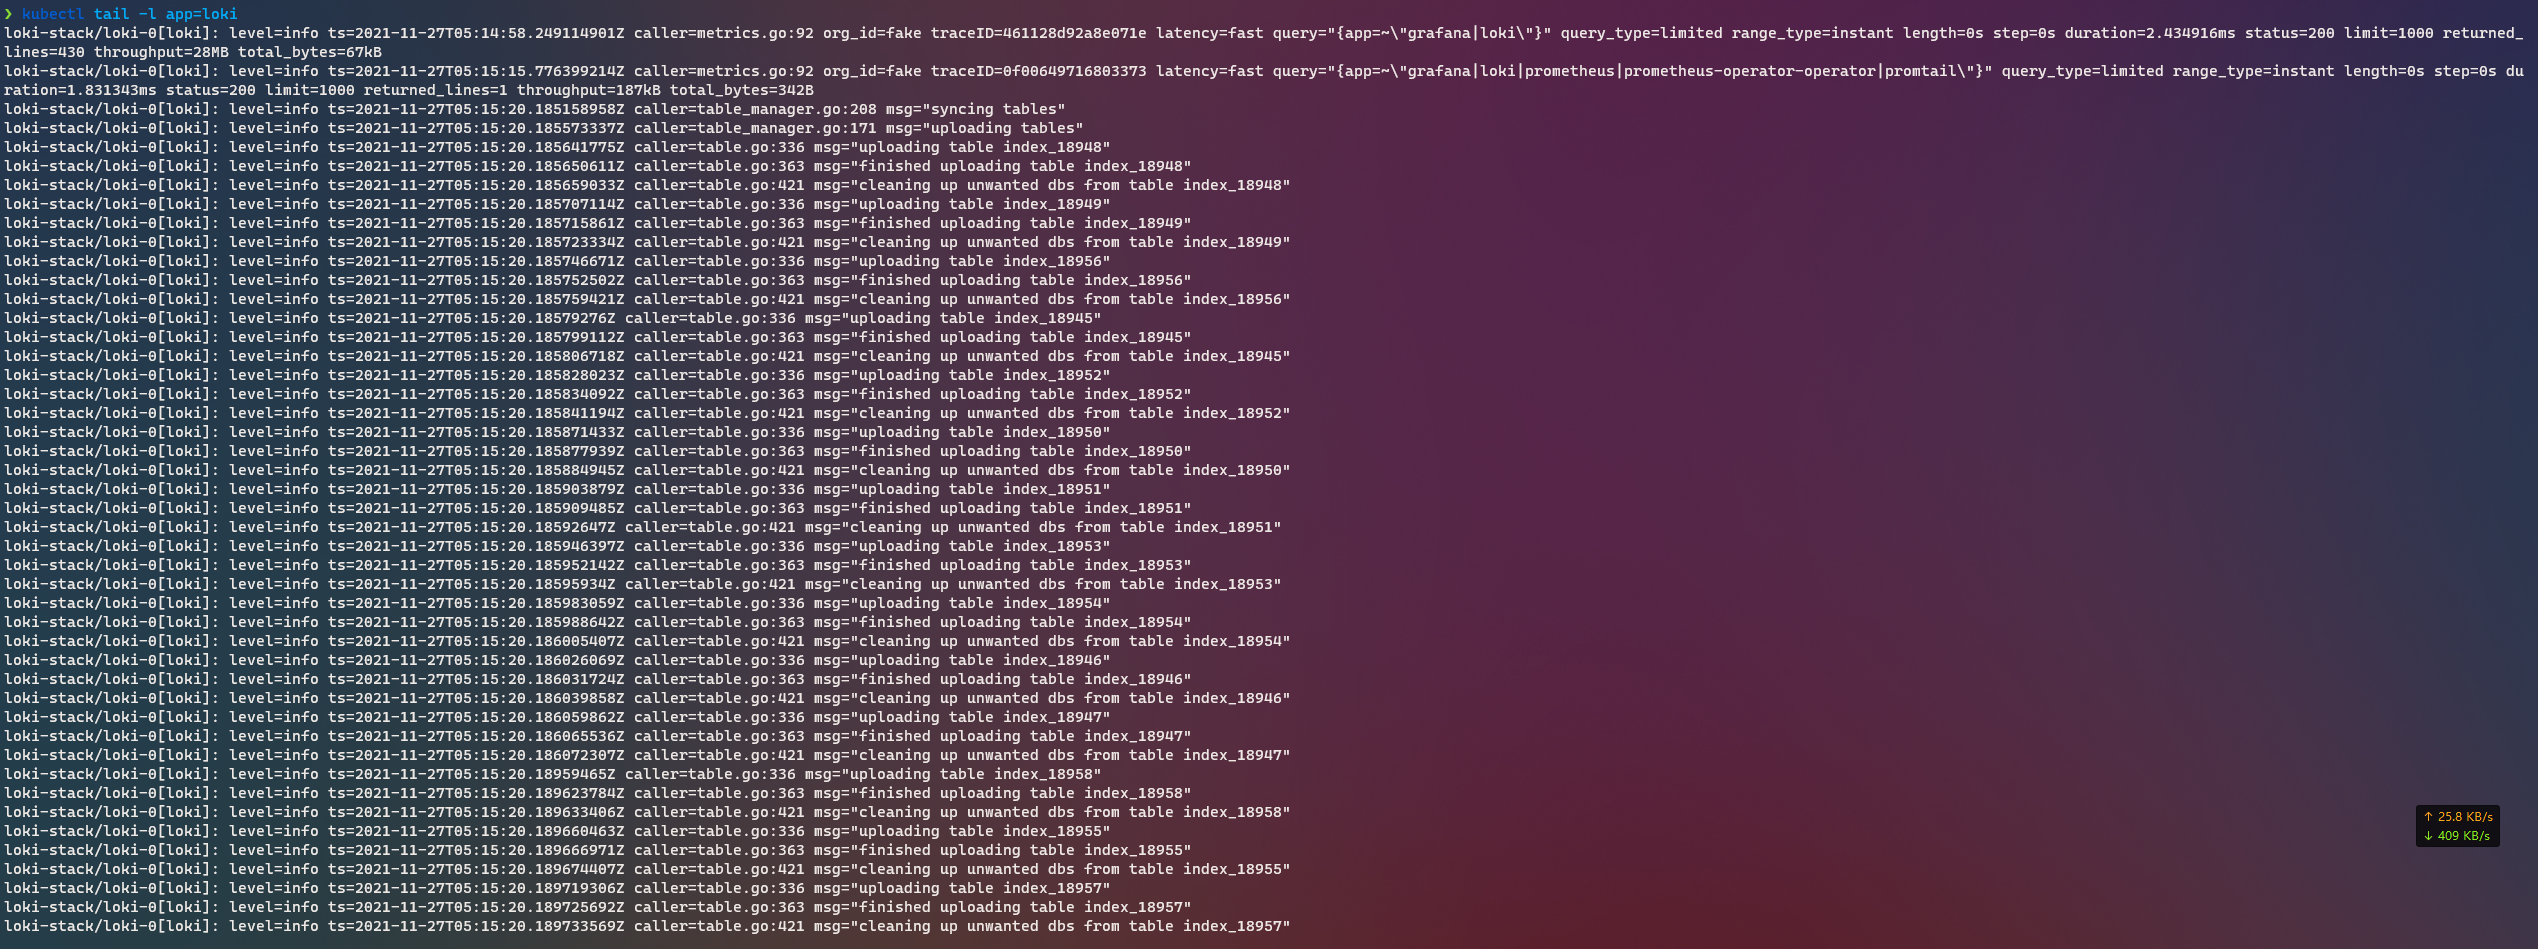
tail - kubernetes tail
Kubernetes tail。将所有匹配 pod 的所有容器的日志流。按 service、replicaset、deployment 等匹配 pod。调整到变化的集群——当pod落入或退出选择时,将从日志中添加或删除它们。
安装
kubectl krew install tail使用
# 匹配所有 pod$ kubectl tail# 配置 staging ns 的所有 pod$ kubectl tail --ns staging# 匹配所有 ns 的 rs name 为 worker 的 pod$ kubectl tail --rs workers# 匹配 staging ns 的 rs name 为 worker 的 pod$ kubectl tail --rs staging/workers# 匹配 deploy 属于 webapp,且 svc 属于 frontend 的 pod$ kubectl tail --svc frontend --deploy webapp使用效果如下,最前面会加上日志对应的 pod:
trace
使用系统工具跟踪 Kubernetes pod 和 node。
kubectl trace 是一个 kubectl 插件,它允许你在 Kubernetes 集群中调度 bpftrace 程序的执行。
安装
kubectl krew install trace使用
这块不太了解,就不多做评论了。
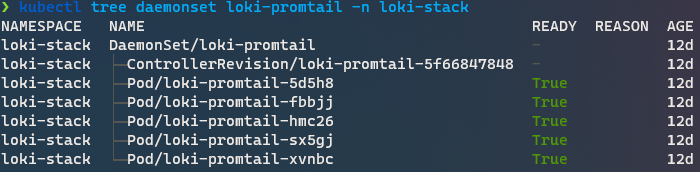
kubectl trace run ip-180-12-0-152.ec2.internal -f read.bttree

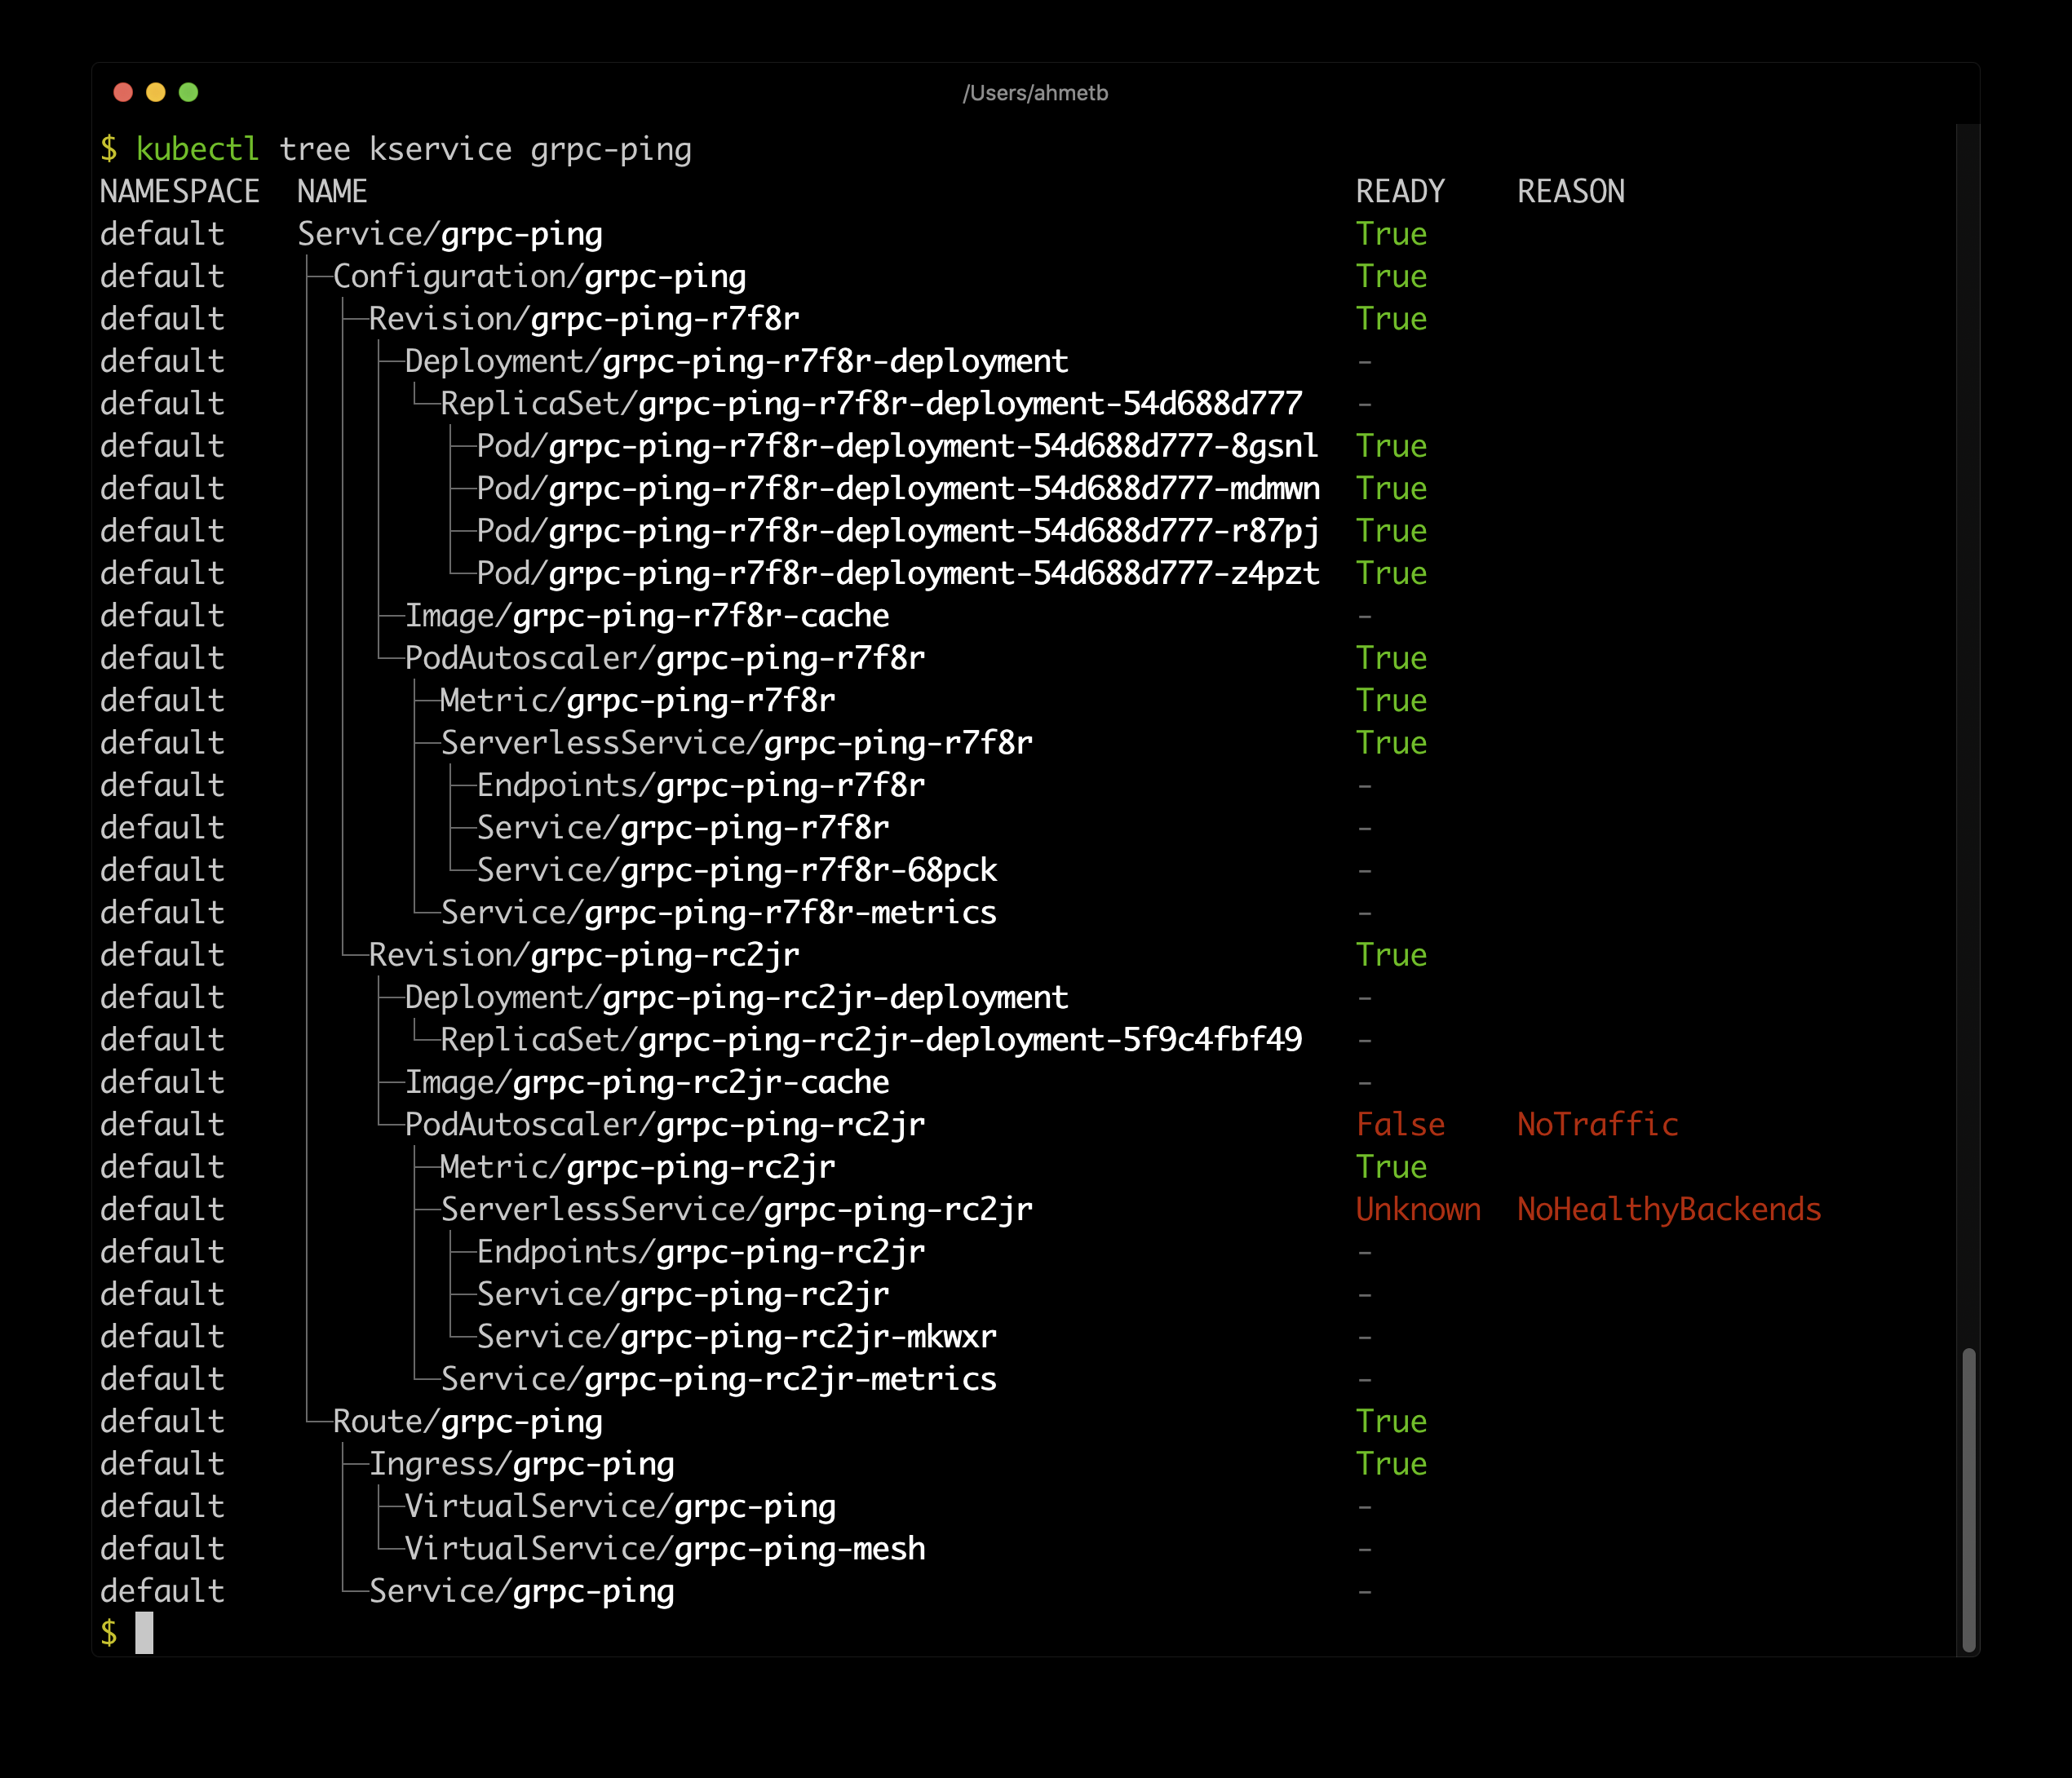
一个 kubectl插件,通过对 Kubernetes 对象的 ownersReferences来探索它们之间的所有权关系。
安装
使用 krew 插件管理器安装:
kubectl krew install tree
kubectl tree --help
使用
DaemonSet 示例:
Knative Service 示例:
tunnel
集群和你自己机器之间的反向隧道.
它允许您将计算机作为集群中的服务公开,或者将其公开给特定的部署。这个项目的目的是为这个特定的问题提供一个整体的解决方案(从kubernetes pod访问本地机器)。
安装
kubectl krew install tunnel使用
以下命令将允许集群中的 pod 通过 http 访问您的本地 web 应用程序(监听端口 8000)(即 kubernetes 应用程序可以发送请求到myapp:8000)
ktunnel expose myapp 80:8000
ktunnel expose myapp 80:8000 -r #deployment & service will be reused if exists or they will be created
warp
在 Pod 中同步和执行本地文件
kubectl (Kubernetes CLI)插件,就像 kubectl 运行与 rsync。
它创建临时 Pod,并将本地文件同步到所需的容器,并执行任何命令。
例如,这可以用于在 Kubernetes 中构建和运行您的本地项目,其中有更多的资源、所需的架构等,同时在本地使用您的首选编辑器。
安装
kubectl krew install warp使用
# 在 ubuntu 镜像中启动 bash。并将当前目录中的文件同步到容器中
kubectl warp -i -t --image ubuntu testing -- /bin/bash# 在 node 容器中启动 nodejs 项目
cd examples/nodejs
kubectl warp -i -t --image node testing-node -- npm run watch
who-can
显示谁具有访问 Kubernetes 资源的 RBAC 权限
安装
kubectl krew install who-can使用
$ kubectl who-can create ns all-namespaces
No subjects found with permissions to create ns assigned through RoleBindingsCLUSTERROLEBINDING            SUBJECT           TYPE            SA-NAMESPACE
cluster-admin                 system:masters    Group
helm-kube-system-traefik-crd  helm-traefik-crd  ServiceAccount  kube-system
helm-kube-system-traefik      helm-traefik      ServiceAccount  kube-system
EOF
三人行, 必有我师; 知识共享, 天下为公. 本文由东风微鸣技术博客 EWhisper.cn 编写.